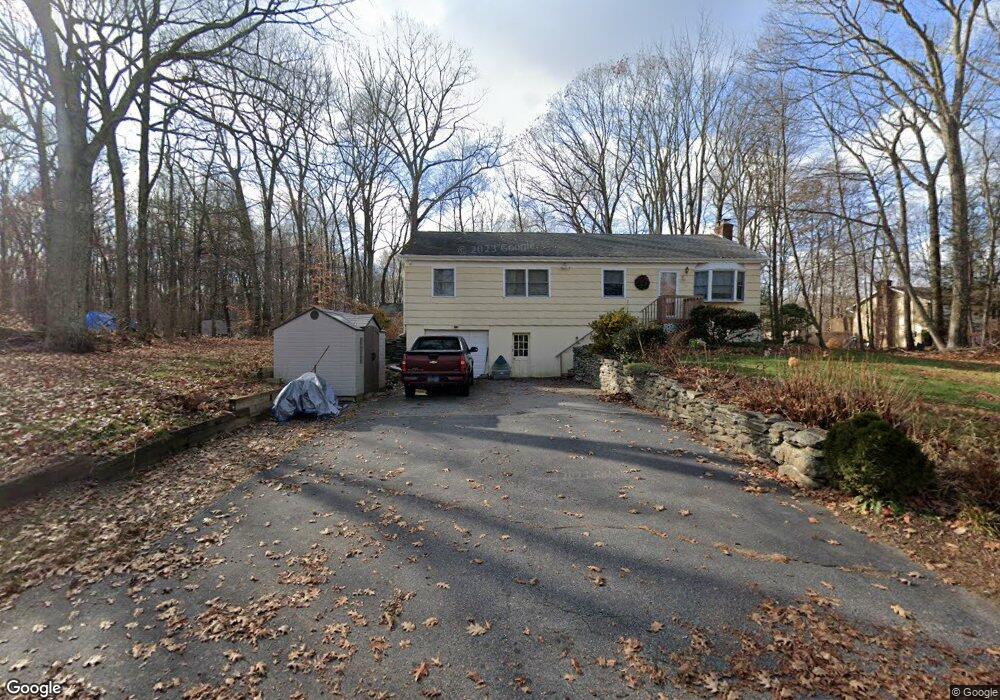
10 Hunt Rd Columbia, CT 06237
Estimated Value: $325,250 - $377,000
3
Beds
1
Bath
1,550
Sq Ft
$233/Sq Ft
Est. Value
About This Home
This home is located at 10 Hunt Rd, Columbia, CT 06237 and is currently estimated at $361,813, approximately $233 per square foot. 10 Hunt Rd is a home located in Tolland County with nearby schools including Horace W. Porter School.
Ownership History
Date
Name
Owned For
Owner Type
Purchase Details
Closed on
Nov 9, 2020
Sold by
Zelonka Tracie L
Bought by
Robinson Robbie L
Current Estimated Value
Home Financials for this Owner
Home Financials are based on the most recent Mortgage that was taken out on this home.
Original Mortgage
$186,558
Interest Rate
2.8%
Mortgage Type
FHA
Purchase Details
Closed on
Feb 24, 1986
Bought by
Pesce Thomas M and Pesce Kathleen A
Create a Home Valuation Report for This Property
The Home Valuation Report is an in-depth analysis detailing your home's value as well as a comparison with similar homes in the area
Home Values in the Area
Average Home Value in this Area
Purchase History
| Date | Buyer | Sale Price | Title Company |
|---|---|---|---|
| Robinson Robbie L | $190,000 | None Available | |
| Pesce Thomas M | -- | -- |
Source: Public Records
Mortgage History
| Date | Status | Borrower | Loan Amount |
|---|---|---|---|
| Previous Owner | Robinson Robbie L | $186,558 | |
| Previous Owner | Pesce Thomas M | $140,000 | |
| Previous Owner | Pesce Thomas M | $100,000 | |
| Previous Owner | Pesce Thomas M | $85,000 |
Source: Public Records
Tax History Compared to Growth
Tax History
| Year | Tax Paid | Tax Assessment Tax Assessment Total Assessment is a certain percentage of the fair market value that is determined by local assessors to be the total taxable value of land and additions on the property. | Land | Improvement |
|---|---|---|---|---|
| 2025 | $4,163 | $142,240 | $43,190 | $99,050 |
| 2024 | $4,000 | $142,240 | $43,190 | $99,050 |
| 2023 | $3,685 | $142,240 | $43,190 | $99,050 |
| 2022 | $3,680 | $142,240 | $43,190 | $99,050 |
| 2021 | $3,549 | $121,000 | $44,100 | $76,900 |
| 2020 | $3,549 | $121,000 | $44,100 | $76,900 |
| 2019 | $3,549 | $121,000 | $44,100 | $76,900 |
| 2018 | $3,549 | $121,000 | $44,100 | $76,900 |
| 2017 | $3,494 | $121,000 | $44,100 | $76,900 |
| 2016 | $3,334 | $121,500 | $44,100 | $77,400 |
| 2015 | $3,296 | $121,500 | $44,100 | $77,400 |
| 2014 | $3,296 | $121,500 | $44,100 | $77,400 |
Source: Public Records
Map
Nearby Homes
- 0 Wells Wood Rd Unit 24118855
- 0 Hunt Rd
- 18 Wells Woods Rd
- 22 Lake Ridge Dr
- 00 Zola Rd
- 64 Loveland Rd
- 65 Wellswood Rd
- 80 Wellswood Rd Unit 9
- 49 Millstream Rd
- 78 Hennequin Rd
- 35 Basket Shop Rd
- 55 Pine St
- 129 Pine St
- 4 Timber Trail
- 191 Pine St
- 1 Church St
- 2 Church St
- 14 Jeremy Way Unit 14
- 222 Gilead St
- 74 Erdoni Rd