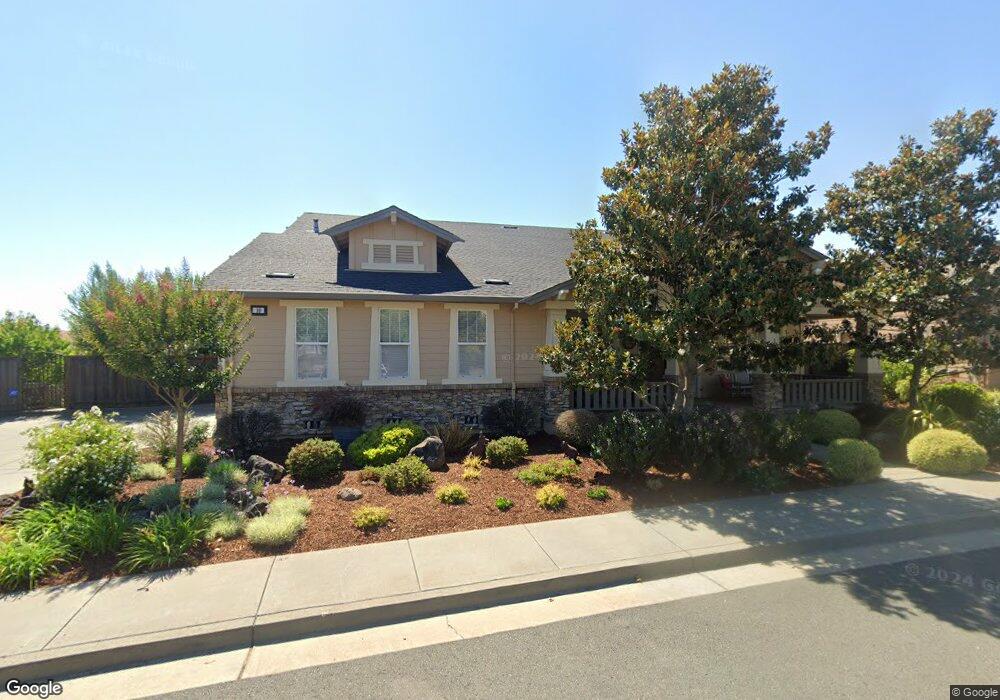
10 Iverson Way Petaluma, CA 94952
Western Petaluma NeighborhoodEstimated Value: $1,809,233 - $2,142,000
5
Beds
5
Baths
3,939
Sq Ft
$502/Sq Ft
Est. Value
About This Home
This home is located at 10 Iverson Way, Petaluma, CA 94952 and is currently estimated at $1,977,308, approximately $501 per square foot. 10 Iverson Way is a home located in Sonoma County with nearby schools including Wilson Elementary School, Petaluma Junior High School, and Petaluma High School.
Ownership History
Date
Name
Owned For
Owner Type
Purchase Details
Closed on
Jun 25, 2013
Sold by
Working Circle Llc
Bought by
Manning Roger J and Manning Jane B
Current Estimated Value
Purchase Details
Closed on
Dec 12, 2011
Sold by
Tighe Raymond H and Raymond H Tighe 2004 Family Tr
Bought by
Working Circle Llc
Purchase Details
Closed on
Jul 3, 2008
Sold by
Nave Conroy Martin C and Nave Conroy Dominique
Bought by
Tighe Raymond H and Raymond H Tighe 2004 Family Tr
Home Financials for this Owner
Home Financials are based on the most recent Mortgage that was taken out on this home.
Original Mortgage
$570,000
Interest Rate
6.04%
Mortgage Type
Purchase Money Mortgage
Purchase Details
Closed on
Mar 13, 2006
Sold by
Rockridge Pointe Investors Lp
Bought by
Nave Conroy Martin C and Nave Conroy Dominique
Home Financials for this Owner
Home Financials are based on the most recent Mortgage that was taken out on this home.
Original Mortgage
$650,000
Interest Rate
1.5%
Mortgage Type
Fannie Mae Freddie Mac
Create a Home Valuation Report for This Property
The Home Valuation Report is an in-depth analysis detailing your home's value as well as a comparison with similar homes in the area
Home Values in the Area
Average Home Value in this Area
Purchase History
| Date | Buyer | Sale Price | Title Company |
|---|---|---|---|
| Manning Roger J | $1,200,000 | Fidelity National Title Co | |
| Working Circle Llc | -- | None Available | |
| Tighe Raymond H | $950,000 | Financial Title Company | |
| Nave Conroy Martin C | $1,182,000 | First American Title Co |
Source: Public Records
Mortgage History
| Date | Status | Borrower | Loan Amount |
|---|---|---|---|
| Previous Owner | Tighe Raymond H | $570,000 | |
| Previous Owner | Nave Conroy Martin C | $650,000 |
Source: Public Records
Tax History
| Year | Tax Paid | Tax Assessment Tax Assessment Total Assessment is a certain percentage of the fair market value that is determined by local assessors to be the total taxable value of land and additions on the property. | Land | Improvement |
|---|---|---|---|---|
| 2025 | $15,609 | $1,477,700 | $591,079 | $886,621 |
| 2024 | $15,609 | $1,448,727 | $579,490 | $869,237 |
| 2023 | $15,609 | $1,420,322 | $568,128 | $852,194 |
| 2022 | $15,276 | $1,392,474 | $556,989 | $835,485 |
| 2021 | $14,930 | $1,365,171 | $546,068 | $819,103 |
| 2020 | $15,046 | $1,351,174 | $540,469 | $810,705 |
| 2019 | $14,854 | $1,324,681 | $529,872 | $794,809 |
| 2018 | $14,771 | $1,298,708 | $519,483 | $779,225 |
| 2017 | $14,521 | $1,273,245 | $509,298 | $763,947 |
| 2016 | $14,077 | $1,248,280 | $499,312 | $748,968 |
| 2015 | $13,733 | $1,229,530 | $491,812 | $737,718 |
| 2014 | $13,563 | $1,205,447 | $482,179 | $723,268 |
Source: Public Records
Map
Nearby Homes
Your Personal Tour Guide
Ask me questions while you tour the home.