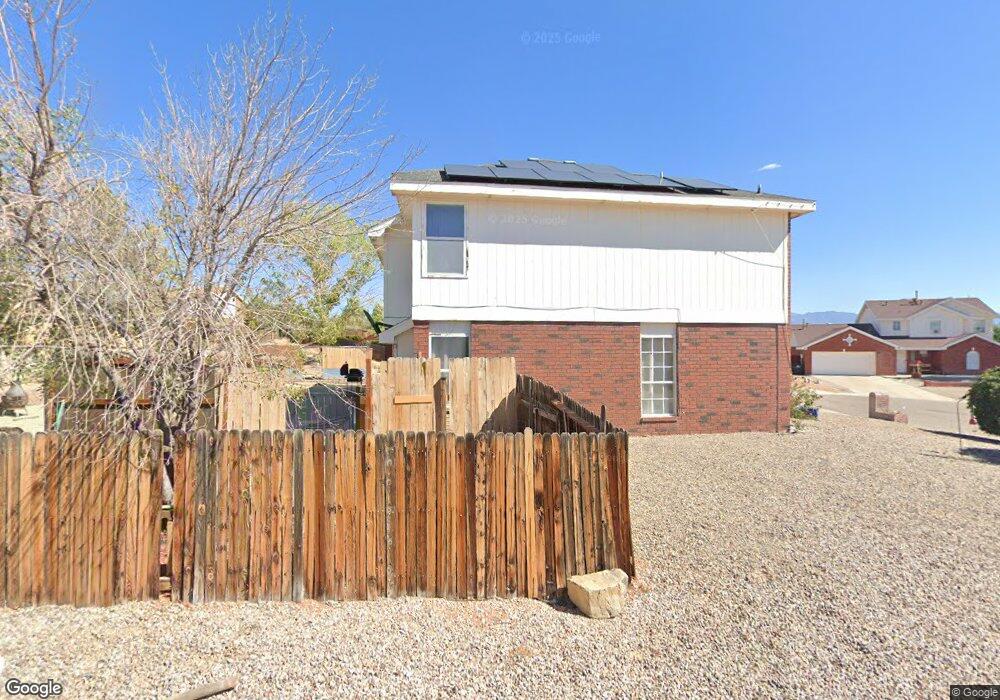
10 Juniper Place Unit 1 Los Lunas, NM 87031
Las Maravillas NeighborhoodEstimated Value: $293,000 - $342,000
4
Beds
3
Baths
2,352
Sq Ft
$135/Sq Ft
Est. Value
About This Home
This home is located at 10 Juniper Place Unit 1, Los Lunas, NM 87031 and is currently estimated at $317,467, approximately $134 per square foot. 10 Juniper Place Unit 1 is a home located in Valencia County with nearby schools including Desert View Elementary School, Valencia Middle School, and Valencia High School.
Ownership History
Date
Name
Owned For
Owner Type
Purchase Details
Closed on
Aug 12, 2021
Sold by
Peralta Valerie
Bought by
Aragon David
Current Estimated Value
Purchase Details
Closed on
Nov 13, 2020
Sold by
Mcguill Rory P and Mcguill Sara L
Bought by
Peralta Valerie
Home Financials for this Owner
Home Financials are based on the most recent Mortgage that was taken out on this home.
Original Mortgage
$200,305
Interest Rate
2.8%
Mortgage Type
New Conventional
Purchase Details
Closed on
Dec 30, 2008
Sold by
Gallegos Kristi V and Reilley Kristi V
Bought by
Mcguill Sara L and Mcguill Rory P
Home Financials for this Owner
Home Financials are based on the most recent Mortgage that was taken out on this home.
Original Mortgage
$167,785
Interest Rate
5.99%
Mortgage Type
FHA
Create a Home Valuation Report for This Property
The Home Valuation Report is an in-depth analysis detailing your home's value as well as a comparison with similar homes in the area
Home Values in the Area
Average Home Value in this Area
Purchase History
| Date | Buyer | Sale Price | Title Company |
|---|---|---|---|
| Aragon David | -- | Fidelity National Ttl Ins Co | |
| Peralta Valerie | -- | Fidelity National Ttl Ins Co | |
| Mcguill Sara L | -- | -- |
Source: Public Records
Mortgage History
| Date | Status | Borrower | Loan Amount |
|---|---|---|---|
| Previous Owner | Peralta Valerie | $200,305 | |
| Previous Owner | Mcguill Sara L | $167,785 |
Source: Public Records
Tax History Compared to Growth
Tax History
| Year | Tax Paid | Tax Assessment Tax Assessment Total Assessment is a certain percentage of the fair market value that is determined by local assessors to be the total taxable value of land and additions on the property. | Land | Improvement |
|---|---|---|---|---|
| 2024 | $1,841 | $73,863 | $9,105 | $64,758 |
| 2023 | $1,813 | $71,712 | $9,105 | $62,607 |
| 2022 | $1,820 | $72,444 | $9,105 | $63,339 |
| 2021 | $1,719 | $68,000 | $9,105 | $58,895 |
| 2020 | $1,630 | $65,561 | $9,105 | $56,456 |
| 2019 | $1,624 | $65,561 | $9,105 | $56,456 |
| 2018 | $1,587 | $64,703 | $9,105 | $55,598 |
| 2017 | $1,525 | $62,819 | $9,105 | $53,714 |
| 2016 | $1,463 | $60,989 | $9,105 | $51,884 |
| 2015 | -- | $59,213 | $9,105 | $50,108 |
| 2013 | -- | $55,814 | $9,105 | $46,709 |
| 2011 | -- | $162,567 | $26,520 | $136,047 |
Source: Public Records
Map
Nearby Homes
- 16 Lirio Place
- 43 Violeta Place
- 16 Apache Plume Rd
- 33 Apache Plume Rd
- 0 Camino La Canada Unit 1022639
- 0 Rio Del Oro (U8 B52 L12 13 14) Unit 1072499
- 9 Genesis Place
- 0 Rio Del Oro Loop N
- 0 Chacon Blvd
- 4 Aldea Place
- Xxx Non Name (S) of La Endrada Rd
- Lot 26, 27 28 Block: 27 Unit: 54
- 26 Aldea Place
- 1 Lot S Rio Del Oro Loop
- 0 S Rio Del Oro Loop Unit 15 1091374
- 0 La Entrada Rd
- RDO Unit 51
- 22 S Rio Del Oro Loop
- 40 Vista Colinas
- Lot 20 Rio Del Oro Unit 60
- 10 Juniper Place
- 8 Juniper Place
- 12 Juniper Place
- 14 Juniper Place
- 9 Juniper Place
- 7 Seda Place
- 7 Juniper Place
- 5 Seda Place
- 11 Juniper Place
- 6 Juniper Place
- 9 Seda Place
- 4 Juniper Place
- 13 Juniper Place
- 5 Juniper Place
- 3 Seda Place
- 11 Seda Place
- 3 Juniper Place
- 15 Juniper Place
- 2 Juniper Place
- 6 Seda Place