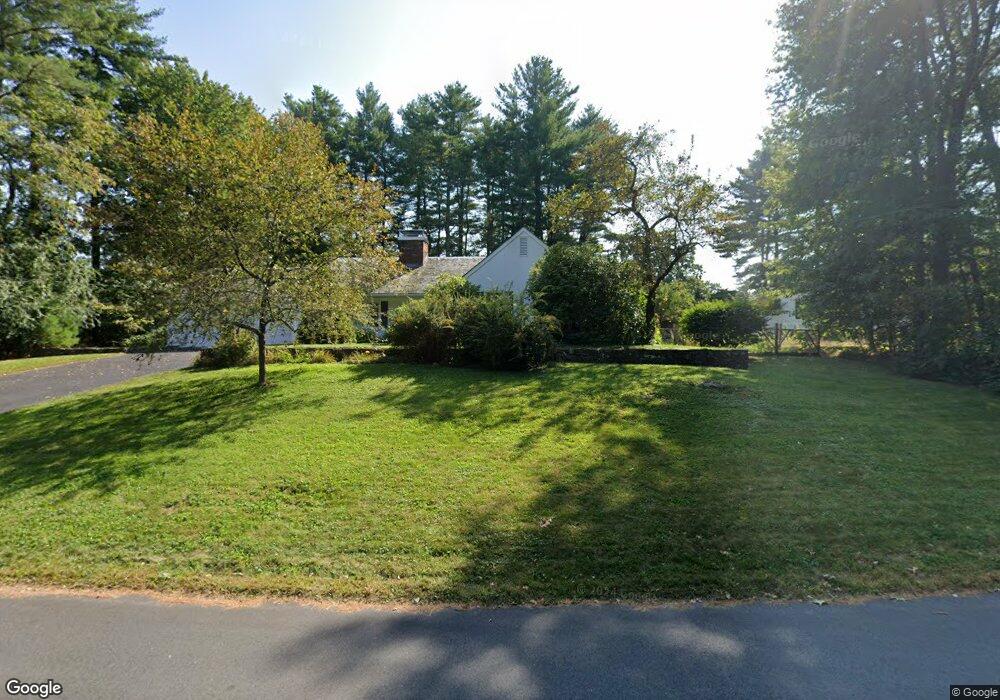
10 Juniper Rd North Hampton, NH 03862
Estimated Value: $645,000 - $860,000
3
Beds
3
Baths
1,843
Sq Ft
$410/Sq Ft
Est. Value
About This Home
This home is located at 10 Juniper Rd, North Hampton, NH 03862 and is currently estimated at $754,716, approximately $409 per square foot. 10 Juniper Rd is a home with nearby schools including North Hampton School, Winnacunnet High School, and Rye Country Day School.
Ownership History
Date
Name
Owned For
Owner Type
Purchase Details
Closed on
Jul 29, 2002
Sold by
Gray Robert W
Bought by
Rickenbach Bradley C
Current Estimated Value
Home Financials for this Owner
Home Financials are based on the most recent Mortgage that was taken out on this home.
Original Mortgage
$269,900
Interest Rate
6.73%
Purchase Details
Closed on
Mar 19, 1997
Sold by
Gaieski Anthony P
Bought by
Gray Robert W and Gray Dawn M
Home Financials for this Owner
Home Financials are based on the most recent Mortgage that was taken out on this home.
Original Mortgage
$120,000
Interest Rate
7.68%
Create a Home Valuation Report for This Property
The Home Valuation Report is an in-depth analysis detailing your home's value as well as a comparison with similar homes in the area
Home Values in the Area
Average Home Value in this Area
Purchase History
| Date | Buyer | Sale Price | Title Company |
|---|---|---|---|
| Rickenbach Bradley C | $389,900 | -- | |
| Gray Robert W | $175,000 | -- |
Source: Public Records
Mortgage History
| Date | Status | Borrower | Loan Amount |
|---|---|---|---|
| Open | Gray Robert W | $200,000 | |
| Closed | Gray Robert W | $269,900 | |
| Previous Owner | Gray Robert W | $120,000 |
Source: Public Records
Tax History
| Year | Tax Paid | Tax Assessment Tax Assessment Total Assessment is a certain percentage of the fair market value that is determined by local assessors to be the total taxable value of land and additions on the property. | Land | Improvement |
|---|---|---|---|---|
| 2024 | $8,406 | $656,700 | $301,500 | $355,200 |
| 2023 | $8,176 | $656,700 | $301,500 | $355,200 |
| 2022 | $7,404 | $431,200 | $194,500 | $236,700 |
| 2021 | $7,145 | $431,200 | $194,500 | $236,700 |
| 2020 | $7,292 | $431,200 | $194,500 | $236,700 |
| 2019 | $7,204 | $431,400 | $194,500 | $236,900 |
| 2018 | $7,006 | $431,400 | $194,500 | $236,900 |
| 2017 | $6,688 | $361,500 | $175,500 | $186,000 |
| 2016 | $6,431 | $361,500 | $175,500 | $186,000 |
| 2015 | $6,319 | $361,500 | $175,500 | $186,000 |
| 2014 | $6,164 | $361,500 | $175,500 | $186,000 |
| 2013 | $6,055 | $361,500 | $175,500 | $186,000 |
Source: Public Records
Map
Nearby Homes
Your Personal Tour Guide
Ask me questions while you tour the home.