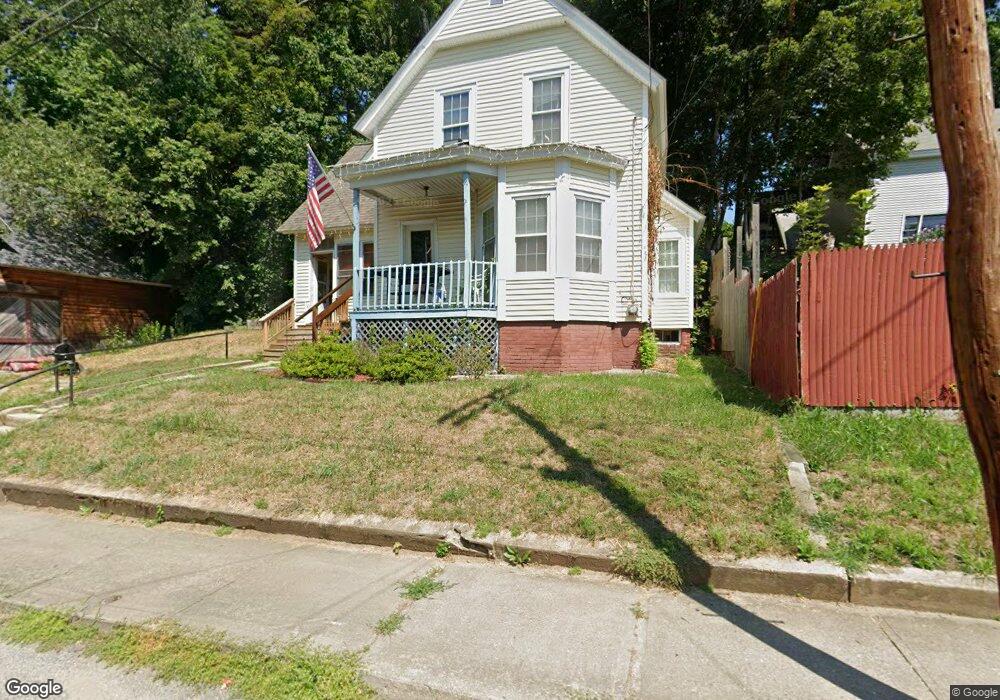
10 Kelton St Orange, MA 01364
Estimated Value: $249,000 - $320,000
3
Beds
1
Bath
1,333
Sq Ft
$207/Sq Ft
Est. Value
About This Home
This home is located at 10 Kelton St, Orange, MA 01364 and is currently estimated at $275,363, approximately $206 per square foot. 10 Kelton St is a home located in Franklin County with nearby schools including Fisher Hill and Ralph C Mahar Regional School.
Ownership History
Date
Name
Owned For
Owner Type
Purchase Details
Closed on
Sep 2, 2016
Sold by
Stevens Franklin J and Stevens Ann C
Bought by
Stevens Franklin J and Stevens Ann C
Current Estimated Value
Purchase Details
Closed on
Jan 5, 2004
Sold by
Britt Norman E and Britt Shirley M
Bought by
Stevens Ann C and Stevens Franklin J
Home Financials for this Owner
Home Financials are based on the most recent Mortgage that was taken out on this home.
Original Mortgage
$55,000
Interest Rate
5.86%
Mortgage Type
Purchase Money Mortgage
Create a Home Valuation Report for This Property
The Home Valuation Report is an in-depth analysis detailing your home's value as well as a comparison with similar homes in the area
Home Values in the Area
Average Home Value in this Area
Purchase History
| Date | Buyer | Sale Price | Title Company |
|---|---|---|---|
| Stevens Franklin J | -- | -- | |
| Stevens Ann C | $30,000 | -- |
Source: Public Records
Mortgage History
| Date | Status | Borrower | Loan Amount |
|---|---|---|---|
| Previous Owner | Stevens Ann C | $55,000 | |
| Previous Owner | Stevens Ann C | $25,000 |
Source: Public Records
Tax History
| Year | Tax Paid | Tax Assessment Tax Assessment Total Assessment is a certain percentage of the fair market value that is determined by local assessors to be the total taxable value of land and additions on the property. | Land | Improvement |
|---|---|---|---|---|
| 2025 | $3,682 | $223,800 | $19,700 | $204,100 |
| 2024 | $3,584 | $205,500 | $19,700 | $185,800 |
| 2023 | $3,179 | $177,000 | $17,800 | $159,200 |
| 2022 | $2,902 | $151,800 | $17,800 | $134,000 |
| 2021 | $2,997 | $149,500 | $39,100 | $110,400 |
| 2020 | $2,862 | $140,800 | $35,600 | $105,200 |
| 2019 | $2,826 | $125,500 | $30,800 | $94,700 |
| 2018 | $2,527 | $115,200 | $28,800 | $86,400 |
| 2017 | $2,446 | $115,200 | $28,800 | $86,400 |
| 2016 | $2,318 | $106,800 | $25,700 | $81,100 |
| 2015 | $1,859 | $89,500 | $27,400 | $62,100 |
| 2014 | $1,889 | $95,700 | $27,400 | $68,300 |
Source: Public Records
Map
Nearby Homes
- 35 Ball St
- 166-168 W Main St
- 30 Cottage St
- 36 Summit St Unit A
- 36 Summit St Unit B
- 56 Shelter St
- 12-14 E Main St
- 50 E Main St
- 222 W River St
- 58 E Main St
- 49 Lincoln Ave
- 23 E Howe St
- 270 S Main St
- 313-315 Walnut Hill Rd
- 216 Holtshire Rd
- 490 S Main St
- 549 E Main St
- 00 S Main St
- 000 S Main St
- 246 Holtshire Rd Unit Lot 3
Your Personal Tour Guide
Ask me questions while you tour the home.