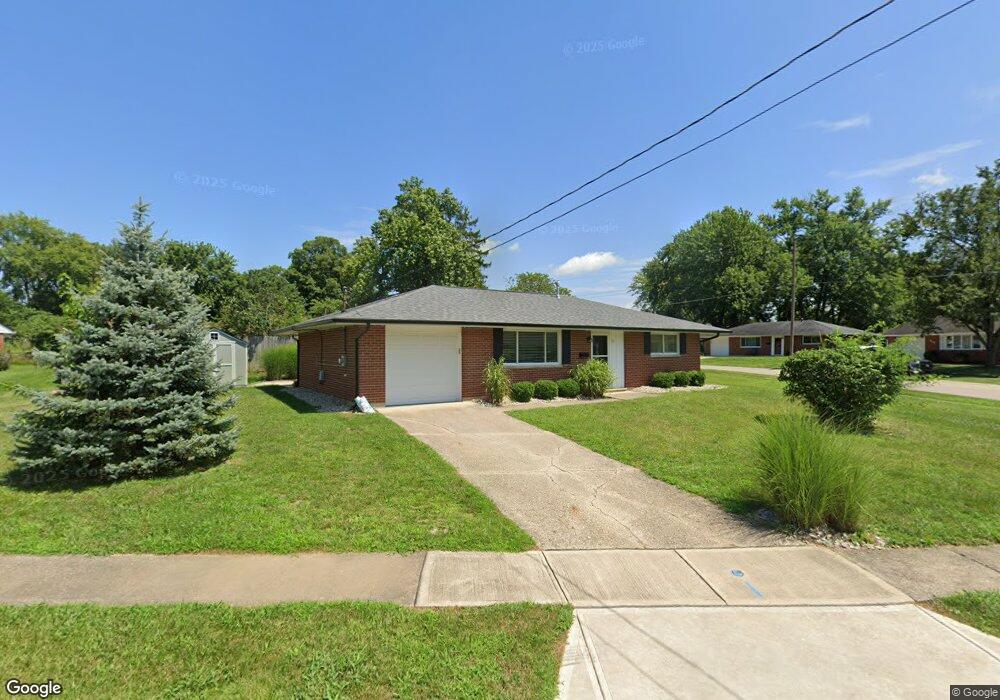
10 King Cir Springboro, OH 45066
Estimated Value: $204,713 - $232,000
3
Beds
2
Baths
980
Sq Ft
$224/Sq Ft
Est. Value
About This Home
This home is located at 10 King Cir, Springboro, OH 45066 and is currently estimated at $219,428, approximately $223 per square foot. 10 King Cir is a home located in Warren County with nearby schools including Clearcreek Elementary School, Springboro Intermediate School, and Dennis Elementary School.
Ownership History
Date
Name
Owned For
Owner Type
Purchase Details
Closed on
Jan 9, 2019
Sold by
Abbydrewin Vestments Llc
Bought by
Diehl Janet
Current Estimated Value
Purchase Details
Closed on
Jul 5, 2017
Sold by
U S Bank National Association
Bought by
Abbydrew Investments Llc
Purchase Details
Closed on
Jun 12, 2015
Sold by
Jpmorgan Chase Bank National Association
Bought by
Us Bank National Association and Ows Remic Trust 2015 1
Purchase Details
Closed on
Oct 30, 2009
Sold by
Cummings Mary Viola
Bought by
Cummings Leroy V
Home Financials for this Owner
Home Financials are based on the most recent Mortgage that was taken out on this home.
Original Mortgage
$98,188
Interest Rate
4.96%
Mortgage Type
FHA
Create a Home Valuation Report for This Property
The Home Valuation Report is an in-depth analysis detailing your home's value as well as a comparison with similar homes in the area
Home Values in the Area
Average Home Value in this Area
Purchase History
| Date | Buyer | Sale Price | Title Company |
|---|---|---|---|
| Diehl Janet | $134,000 | None Available | |
| Abbydrew Investments Llc | $70,000 | None Available | |
| Us Bank National Association | $95,300 | None Available | |
| Cummings Leroy V | $100,000 | Springdale Title |
Source: Public Records
Mortgage History
| Date | Status | Borrower | Loan Amount |
|---|---|---|---|
| Previous Owner | Cummings Leroy V | $98,188 |
Source: Public Records
Tax History
| Year | Tax Paid | Tax Assessment Tax Assessment Total Assessment is a certain percentage of the fair market value that is determined by local assessors to be the total taxable value of land and additions on the property. | Land | Improvement |
|---|---|---|---|---|
| 2025 | $1,561 | $49,770 | $17,500 | $32,270 |
| 2024 | $1,561 | $49,770 | $17,500 | $32,270 |
| 2023 | $1,287 | $39,434 | $10,762 | $28,672 |
| 2022 | $1,287 | $39,435 | $10,763 | $28,672 |
| 2021 | $1,198 | $39,435 | $10,763 | $28,672 |
| 2020 | $1,432 | $32,060 | $8,750 | $23,310 |
| 2019 | $1,357 | $32,060 | $8,750 | $23,310 |
| 2018 | $1,358 | $32,060 | $8,750 | $23,310 |
| 2017 | $1,344 | $29,376 | $8,134 | $21,242 |
| 2016 | $1,401 | $29,376 | $8,134 | $21,242 |
| 2015 | $1,440 | $29,376 | $8,134 | $21,242 |
| 2014 | $1,440 | $28,520 | $7,900 | $20,620 |
| 2013 | $1,439 | $31,600 | $8,750 | $22,850 |
Source: Public Records
Map
Nearby Homes
- 84 W Mill St
- 10 Woods Rd
- 330 East St
- 35 Edgebrooke Dr
- 490 W Market St
- 80 Elkins Ln
- 60 Rosewood Dr
- 50 Morris St
- 45 Morris St Unit 15
- 8 Glasgow St Unit 30
- 18 Glasgow St
- 65 Morris St Unit 17
- 45 Morris St
- 18 Glasgow St Unit 29
- 8 Glasgow St
- 30 Morris St
- 50 Morris St Unit 4
- 65 Morris St
- 65 Ed Knoll Bend
- 40 Libby Hollow St
Your Personal Tour Guide
Ask me questions while you tour the home.