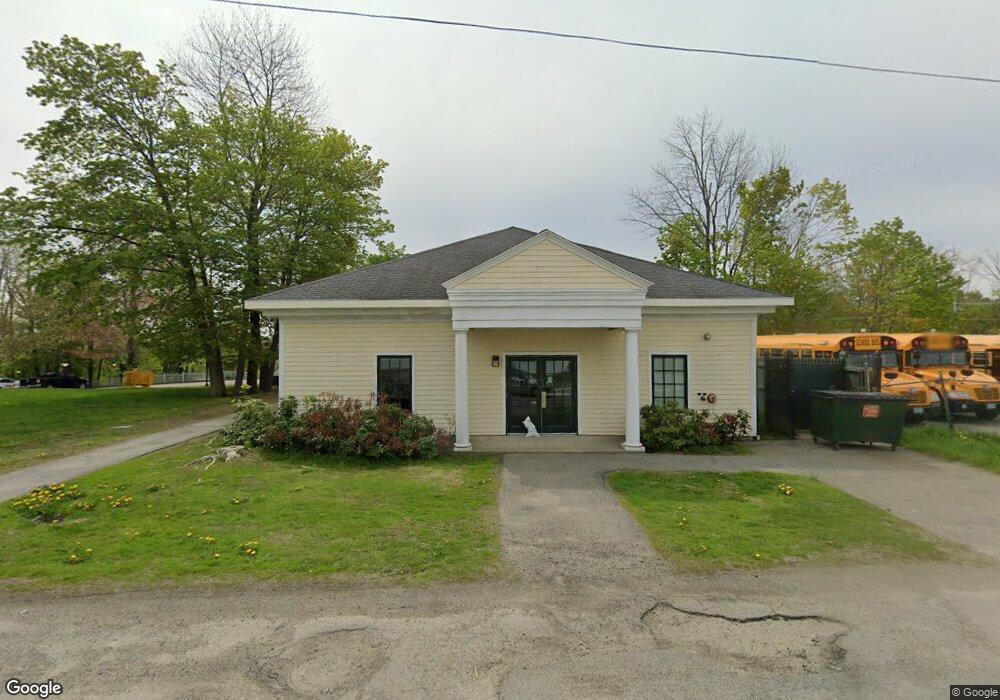
10 Knowlton St Camden, ME 04843
Estimated Value: $763,686
--
Bed
--
Bath
8,345
Sq Ft
$92/Sq Ft
Est. Value
About This Home
This home is located at 10 Knowlton St, Camden, ME 04843 and is currently estimated at $763,686, approximately $91 per square foot. 10 Knowlton St is a home located in Knox County with nearby schools including Camden-Rockport Elementary School, Camden-Rockport Middle School, and Camden Hills Regional High School.
Ownership History
Date
Name
Owned For
Owner Type
Purchase Details
Closed on
Sep 11, 2020
Sold by
Penobscot Bay Y
Bought by
Schwalm Llc
Current Estimated Value
Home Financials for this Owner
Home Financials are based on the most recent Mortgage that was taken out on this home.
Original Mortgage
$100,000
Outstanding Balance
$88,339
Interest Rate
2.9%
Mortgage Type
New Conventional
Estimated Equity
$675,347
Purchase Details
Closed on
Dec 29, 2005
Sold by
Mbna Marketing Sys Inc
Bought by
Teen Center Inc
Create a Home Valuation Report for This Property
The Home Valuation Report is an in-depth analysis detailing your home's value as well as a comparison with similar homes in the area
Home Values in the Area
Average Home Value in this Area
Purchase History
| Date | Buyer | Sale Price | Title Company |
|---|---|---|---|
| Schwalm Llc | -- | None Available | |
| Teen Center Inc | -- | -- | |
| Teen Center Inc | -- | -- |
Source: Public Records
Mortgage History
| Date | Status | Borrower | Loan Amount |
|---|---|---|---|
| Open | Schwalm Llc | $100,000 |
Source: Public Records
Tax History Compared to Growth
Tax History
| Year | Tax Paid | Tax Assessment Tax Assessment Total Assessment is a certain percentage of the fair market value that is determined by local assessors to be the total taxable value of land and additions on the property. | Land | Improvement |
|---|---|---|---|---|
| 2024 | $9,169 | $873,200 | $457,700 | $415,500 |
| 2023 | $9,706 | $703,300 | $292,600 | $410,700 |
| 2022 | $9,284 | $703,300 | $292,600 | $410,700 |
| 2021 | $11,393 | $742,200 | $248,300 | $493,900 |
| 2020 | $0 | $870,700 | $248,300 | $622,400 |
| 2019 | $0 | $922,300 | $248,300 | $674,000 |
| 2018 | $0 | $922,300 | $248,300 | $674,000 |
| 2017 | $0 | $922,300 | $248,300 | $674,000 |
| 2016 | -- | $781,300 | $242,900 | $538,400 |
| 2015 | -- | $781,300 | $242,900 | $538,400 |
| 2014 | -- | $781,300 | $242,900 | $538,400 |
| 2013 | -- | $781,300 | $242,900 | $538,400 |
Source: Public Records
Map
Nearby Homes