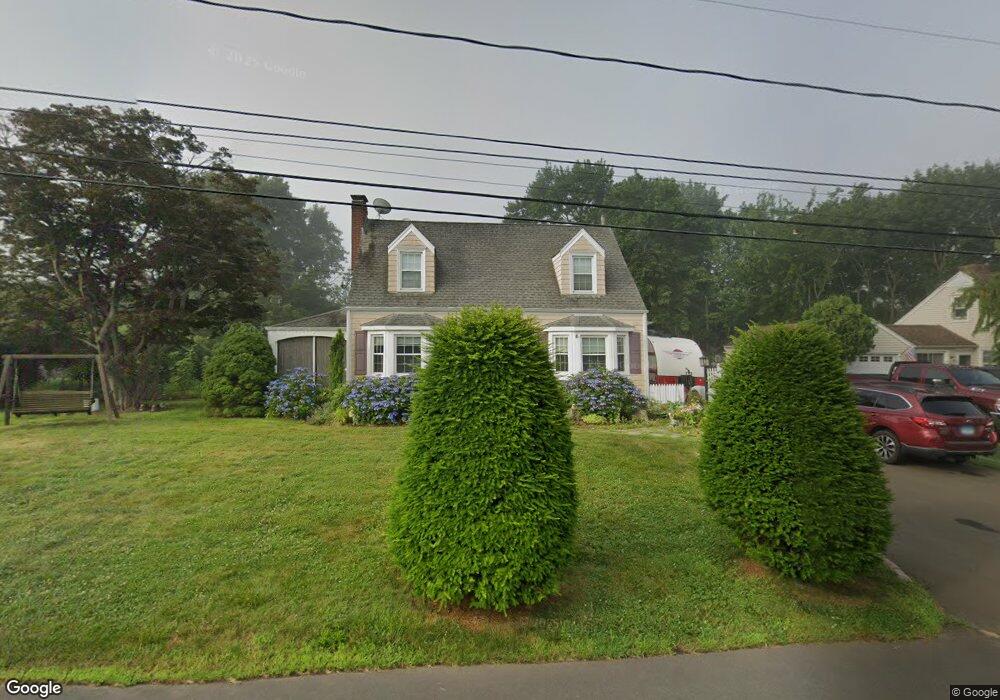
10 Lanphier Rd Branford, CT 06405
Estimated Value: $553,000 - $660,000
1
Bed
1
Bath
1,605
Sq Ft
$376/Sq Ft
Est. Value
About This Home
This home is located at 10 Lanphier Rd, Branford, CT 06405 and is currently estimated at $603,231, approximately $375 per square foot. 10 Lanphier Rd is a home located in New Haven County with nearby schools including Francis Walsh Intermediate School, Branford High School, and East Shoreline Catholic Academy.
Ownership History
Date
Name
Owned For
Owner Type
Purchase Details
Closed on
Dec 19, 2003
Sold by
Russell Irene B
Bought by
Mcnamara Susan I
Current Estimated Value
Home Financials for this Owner
Home Financials are based on the most recent Mortgage that was taken out on this home.
Original Mortgage
$155,000
Outstanding Balance
$72,225
Interest Rate
5.96%
Estimated Equity
$531,006
Create a Home Valuation Report for This Property
The Home Valuation Report is an in-depth analysis detailing your home's value as well as a comparison with similar homes in the area
Home Values in the Area
Average Home Value in this Area
Purchase History
| Date | Buyer | Sale Price | Title Company |
|---|---|---|---|
| Mcnamara Susan I | $324,450 | -- |
Source: Public Records
Mortgage History
| Date | Status | Borrower | Loan Amount |
|---|---|---|---|
| Closed | Mcnamara Susan I | $50,000 | |
| Open | Mcnamara Susan I | $155,000 |
Source: Public Records
Tax History
| Year | Tax Paid | Tax Assessment Tax Assessment Total Assessment is a certain percentage of the fair market value that is determined by local assessors to be the total taxable value of land and additions on the property. | Land | Improvement |
|---|---|---|---|---|
| 2025 | $8,293 | $387,500 | $180,500 | $207,000 |
| 2024 | $6,471 | $212,300 | $98,200 | $114,100 |
| 2023 | $6,346 | $212,300 | $98,200 | $114,100 |
| 2022 | $6,252 | $212,300 | $98,200 | $114,100 |
| 2021 | $6,252 | $212,300 | $98,200 | $114,100 |
| 2020 | $6,140 | $212,300 | $98,200 | $114,100 |
| 2019 | $6,416 | $220,700 | $115,200 | $105,500 |
| 2018 | $6,321 | $220,700 | $115,200 | $105,500 |
| 2017 | $6,283 | $220,700 | $115,200 | $105,500 |
| 2016 | $6,049 | $220,700 | $115,200 | $105,500 |
| 2015 | $5,943 | $220,700 | $115,200 | $105,500 |
| 2014 | $5,991 | $228,300 | $115,200 | $113,100 |
Source: Public Records
Map
Nearby Homes
- 49 Stannard Ave
- 33 Harbour Village Unit D
- 20 Harbour Village Unit G
- 20 Harbour Village Unit A
- 74 Quarry Dock Rd
- 7 Harbour Village Unit A
- 15 River Rd
- 60 Maple St Unit 17
- 60 Maple St Unit 31
- 231 Pawson Rd
- 320 Maple St
- 50 Short Beach Rd
- 6 Stonegate Unit A
- 5 Stonegate Unit F
- 63 Briarwood Ln Unit E
- 10 Hammer Place
- 59 Home Place
- 61-63 Home Place
- 81 Main St Unit 15B
- 104 S Montowese St
Your Personal Tour Guide
Ask me questions while you tour the home.