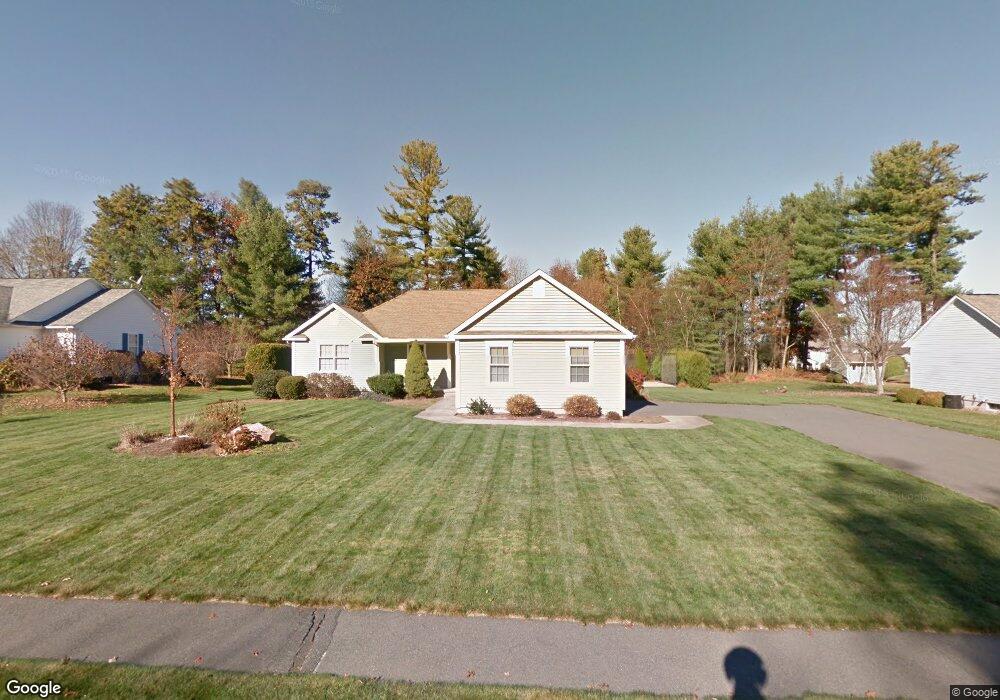
10 Laurel Dr Easthampton, MA 01027
Estimated Value: $486,000 - $567,000
3
Beds
3
Baths
1,531
Sq Ft
$348/Sq Ft
Est. Value
About This Home
This home is located at 10 Laurel Dr, Easthampton, MA 01027 and is currently estimated at $532,796, approximately $348 per square foot. 10 Laurel Dr is a home located in Hampshire County with nearby schools including Easthampton High School, Calvary Baptist Christian School, and Tri-County Schools.
Ownership History
Date
Name
Owned For
Owner Type
Purchase Details
Closed on
Jun 24, 2004
Sold by
Lewandowski Tara K
Bought by
Lewandowski Ronald J
Current Estimated Value
Purchase Details
Closed on
Oct 31, 1997
Sold by
Hardy David A
Bought by
Lewandowski Ronald J and Lewandowski Tara K
Purchase Details
Closed on
Oct 8, 1996
Sold by
Crown Meadow Corp
Bought by
Hardy David A
Create a Home Valuation Report for This Property
The Home Valuation Report is an in-depth analysis detailing your home's value as well as a comparison with similar homes in the area
Home Values in the Area
Average Home Value in this Area
Purchase History
| Date | Buyer | Sale Price | Title Company |
|---|---|---|---|
| Lewandowski Ronald J | -- | -- | |
| Lewandowski Ronald J | $154,000 | -- | |
| Hardy David A | $48,000 | -- |
Source: Public Records
Mortgage History
| Date | Status | Borrower | Loan Amount |
|---|---|---|---|
| Closed | Hardy David A | $87,000 | |
| Previous Owner | Hardy David A | $163,500 | |
| Previous Owner | Hardy David A | $146,000 |
Source: Public Records
Tax History
| Year | Tax Paid | Tax Assessment Tax Assessment Total Assessment is a certain percentage of the fair market value that is determined by local assessors to be the total taxable value of land and additions on the property. | Land | Improvement |
|---|---|---|---|---|
| 2025 | $6,344 | $464,100 | $133,200 | $330,900 |
| 2024 | $6,303 | $464,800 | $129,400 | $335,400 |
| 2023 | $4,988 | $340,500 | $102,800 | $237,700 |
| 2022 | $5,628 | $340,500 | $102,800 | $237,700 |
| 2021 | $6,169 | $351,700 | $102,800 | $248,900 |
| 2020 | $6,047 | $340,500 | $102,800 | $237,700 |
| 2019 | $5,320 | $344,100 | $119,800 | $224,300 |
| 2018 | $5,114 | $319,600 | $113,200 | $206,400 |
| 2017 | $4,998 | $308,300 | $108,600 | $199,700 |
| 2016 | $4,596 | $294,800 | $108,600 | $186,200 |
| 2015 | $4,466 | $294,800 | $108,600 | $186,200 |
Source: Public Records
Map
Nearby Homes
Your Personal Tour Guide
Ask me questions while you tour the home.