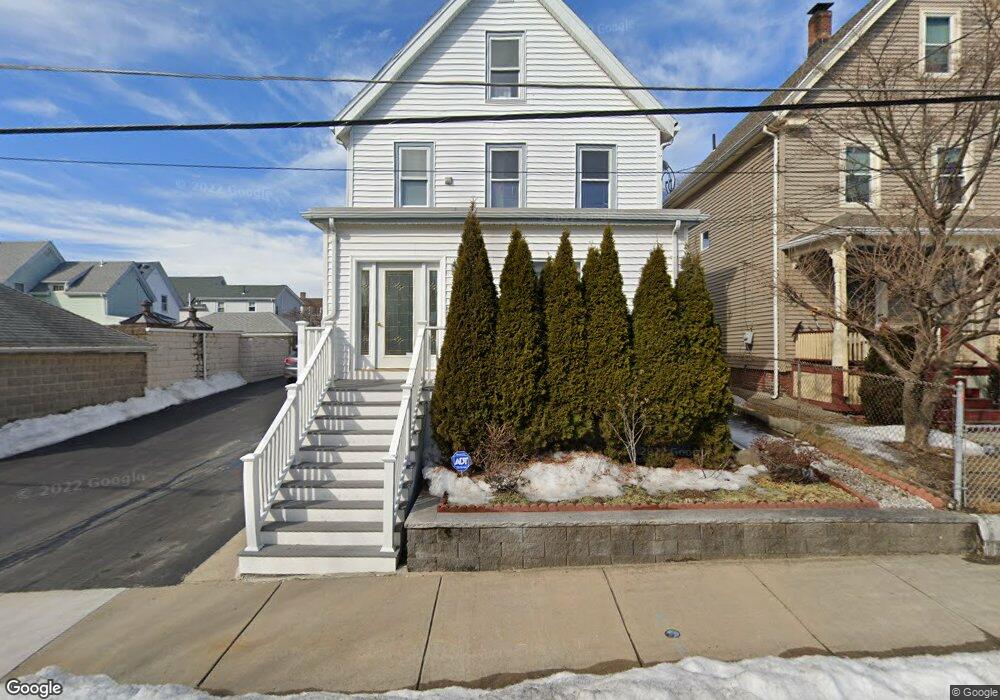
10 Leyden St Medford, MA 02155
South Medford NeighborhoodEstimated Value: $1,008,000 - $1,050,487
6
Beds
3
Baths
2,935
Sq Ft
$349/Sq Ft
Est. Value
About This Home
This home is located at 10 Leyden St, Medford, MA 02155 and is currently estimated at $1,024,872, approximately $349 per square foot. 10 Leyden St is a home located in Middlesex County with nearby schools including Medford High School, St. Clement Elementary School, and Bright Future Educare Center.
Ownership History
Date
Name
Owned For
Owner Type
Purchase Details
Closed on
Feb 3, 2022
Sold by
Lam Tommy J and Lam Xiu Z
Bought by
Lam Ft
Current Estimated Value
Purchase Details
Closed on
May 8, 2009
Sold by
Orna Renato and Dearaujo Carlos
Bought by
Lam Tommy Jia and Lam Xiu Zhen
Home Financials for this Owner
Home Financials are based on the most recent Mortgage that was taken out on this home.
Original Mortgage
$270,000
Interest Rate
4.9%
Mortgage Type
Purchase Money Mortgage
Create a Home Valuation Report for This Property
The Home Valuation Report is an in-depth analysis detailing your home's value as well as a comparison with similar homes in the area
Home Values in the Area
Average Home Value in this Area
Purchase History
| Date | Buyer | Sale Price | Title Company |
|---|---|---|---|
| Lam Ft | -- | None Available | |
| Lam Tommy Jia | $400,000 | -- |
Source: Public Records
Mortgage History
| Date | Status | Borrower | Loan Amount |
|---|---|---|---|
| Previous Owner | Lam Tommy Jia | $270,000 |
Source: Public Records
Tax History Compared to Growth
Tax History
| Year | Tax Paid | Tax Assessment Tax Assessment Total Assessment is a certain percentage of the fair market value that is determined by local assessors to be the total taxable value of land and additions on the property. | Land | Improvement |
|---|---|---|---|---|
| 2025 | $8,127 | $923,500 | $349,300 | $574,200 |
| 2024 | $7,135 | $837,400 | $332,700 | $504,700 |
| 2023 | $6,979 | $806,800 | $310,900 | $495,900 |
| 2022 | $7,014 | $778,500 | $282,600 | $495,900 |
| 2021 | $6,599 | $701,300 | $269,200 | $432,100 |
| 2020 | $6,503 | $708,400 | $269,200 | $439,200 |
| 2019 | $6,191 | $644,900 | $244,700 | $400,200 |
| 2018 | $3,527 | $574,700 | $222,400 | $352,300 |
| 2017 | $5,523 | $523,000 | $207,900 | $315,100 |
| 2016 | $5,384 | $481,100 | $189,000 | $292,100 |
| 2015 | $5,088 | $434,900 | $180,000 | $254,900 |
Source: Public Records
Map
Nearby Homes
- 57 Edward St
- 552 Main St
- 100 Fremont St
- 441 Broadway
- 658 Mystic Ave Unit A
- 474 Broadway Unit 26
- 656 Mystic Ave Unit A
- 656 Mystic Ave Unit B
- 654 Mystic Ave Unit B
- 654 Mystic Ave Unit A
- 9 Norwood Ave
- 501 Main St
- 51 Edgar Ave
- 496 Medford St
- 89 Heath St
- 390 Broadway Unit 24
- 34 Fiske Ave Unit C
- 34 Fiske Ave Unit B
- 34 Fiske Ave Unit A
- 3 Vinal St
- 12 Leyden St
- 16 Leyden St
- 16 Leyden St Unit 2
- 11 Leyden St
- 18 Leyden St
- 13 Leyden St
- 7 Leyden St
- 17 Edward St
- 15 Leyden St
- 19 Edward St
- 11 Sanger St
- 17 Leyden St
- 23 Edward St
- 23 Joseph St Unit 1
- 13 Edward St
- 13 Edward St Unit 2
- 9 Sanger St
- 9 Sanger St Unit 3 -- 3rd Floor
- 9 Sanger St Unit 2
- 9 Sanger St Unit 3