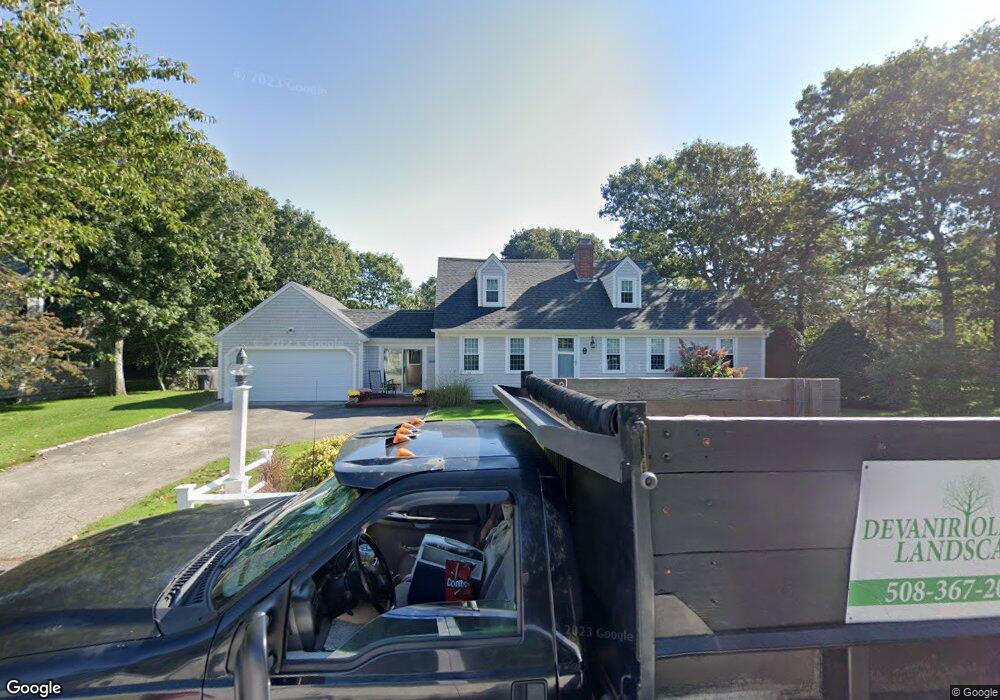
10 Mackenzie Rd South Yarmouth, MA 02664
Estimated Value: $750,000 - $1,112,000
4
Beds
3
Baths
2,201
Sq Ft
$429/Sq Ft
Est. Value
About This Home
This home is located at 10 Mackenzie Rd, South Yarmouth, MA 02664 and is currently estimated at $945,075, approximately $429 per square foot. 10 Mackenzie Rd is a home located in Barnstable County with nearby schools including Dennis-Yarmouth Regional High School and St. Pius X. School.
Ownership History
Date
Name
Owned For
Owner Type
Purchase Details
Closed on
Dec 15, 2011
Sold by
Chesson Harold R and Chesson Laurel A
Bought by
Baker Thomas C and Baker Lisa A
Current Estimated Value
Purchase Details
Closed on
Dec 7, 1994
Sold by
J&R Rt and Cornu Thomas W
Bought by
Chesson Harold R and Chesson Laurel A
Purchase Details
Closed on
Mar 29, 1990
Sold by
Cornu Thomas W
Bought by
J&R Rt
Home Financials for this Owner
Home Financials are based on the most recent Mortgage that was taken out on this home.
Original Mortgage
$67,482
Interest Rate
9.96%
Mortgage Type
Purchase Money Mortgage
Create a Home Valuation Report for This Property
The Home Valuation Report is an in-depth analysis detailing your home's value as well as a comparison with similar homes in the area
Home Values in the Area
Average Home Value in this Area
Purchase History
| Date | Buyer | Sale Price | Title Company |
|---|---|---|---|
| Baker Thomas C | -- | -- | |
| Chesson Harold R | $215,000 | -- | |
| J&R Rt | $265,000 | -- |
Source: Public Records
Mortgage History
| Date | Status | Borrower | Loan Amount |
|---|---|---|---|
| Previous Owner | J&R Rt | $67,482 | |
| Previous Owner | J&R Rt | $200,000 |
Source: Public Records
Tax History Compared to Growth
Tax History
| Year | Tax Paid | Tax Assessment Tax Assessment Total Assessment is a certain percentage of the fair market value that is determined by local assessors to be the total taxable value of land and additions on the property. | Land | Improvement |
|---|---|---|---|---|
| 2025 | $6,782 | $957,900 | $461,400 | $496,500 |
| 2024 | $6,252 | $847,200 | $401,400 | $445,800 |
| 2023 | $5,958 | $734,600 | $327,400 | $407,200 |
| 2022 | $5,530 | $602,400 | $294,100 | $308,300 |
| 2021 | $5,239 | $548,000 | $276,300 | $271,700 |
| 2020 | $4,885 | $488,500 | $264,100 | $224,400 |
| 2019 | $5,566 | $461,800 | $264,100 | $197,700 |
| 2018 | $4,616 | $448,600 | $250,900 | $197,700 |
| 2017 | $4,495 | $448,600 | $250,900 | $197,700 |
| 2016 | $4,477 | $448,600 | $250,900 | $197,700 |
| 2015 | $4,369 | $435,200 | $250,900 | $184,300 |
Source: Public Records
Map
Nearby Homes