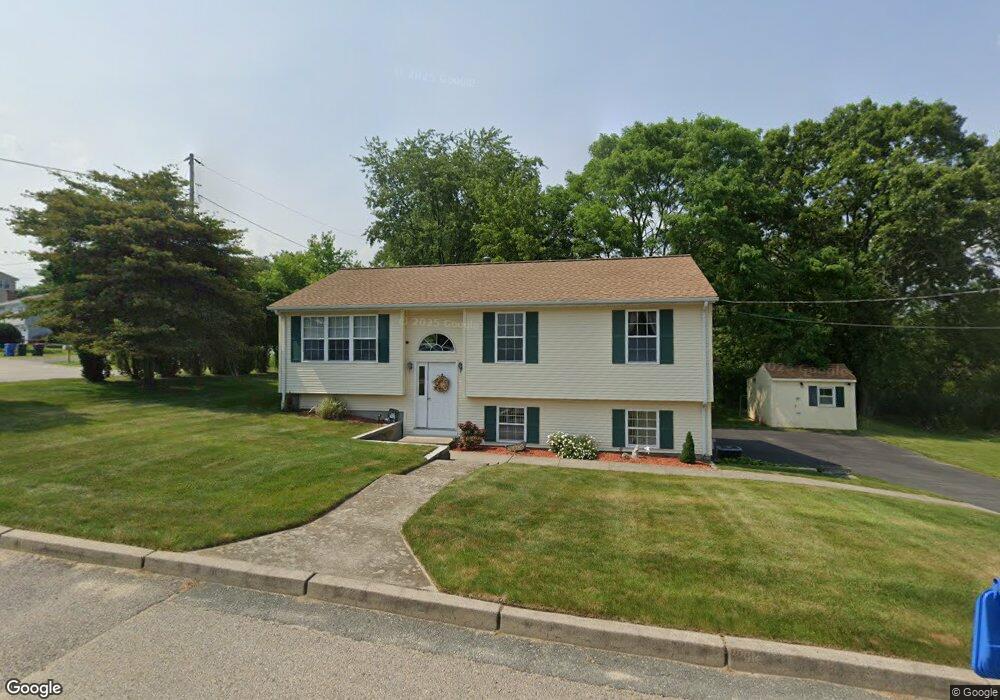
10 Macon St Cranston, RI 02920
Budlong NeighborhoodEstimated Value: $424,332 - $460,000
3
Beds
1
Bath
1,092
Sq Ft
$412/Sq Ft
Est. Value
About This Home
This home is located at 10 Macon St, Cranston, RI 02920 and is currently estimated at $450,333, approximately $412 per square foot. 10 Macon St is a home located in Providence County with nearby schools including Woodridge Elementary School, Western Hills Middle School, and Cranston High School West.
Ownership History
Date
Name
Owned For
Owner Type
Purchase Details
Closed on
Jun 19, 1998
Sold by
Hosey Dev Corp
Bought by
Trottier Francis A
Current Estimated Value
Home Financials for this Owner
Home Financials are based on the most recent Mortgage that was taken out on this home.
Original Mortgage
$99,920
Interest Rate
7.09%
Create a Home Valuation Report for This Property
The Home Valuation Report is an in-depth analysis detailing your home's value as well as a comparison with similar homes in the area
Home Values in the Area
Average Home Value in this Area
Purchase History
| Date | Buyer | Sale Price | Title Company |
|---|---|---|---|
| Trottier Francis A | $125,000 | -- |
Source: Public Records
Mortgage History
| Date | Status | Borrower | Loan Amount |
|---|---|---|---|
| Open | Trottier Francis A | $100,000 | |
| Closed | Trottier Francis A | $95,000 | |
| Closed | Trottier Francis A | $99,920 |
Source: Public Records
Tax History Compared to Growth
Tax History
| Year | Tax Paid | Tax Assessment Tax Assessment Total Assessment is a certain percentage of the fair market value that is determined by local assessors to be the total taxable value of land and additions on the property. | Land | Improvement |
|---|---|---|---|---|
| 2025 | $4,802 | $346,000 | $103,800 | $242,200 |
| 2024 | $4,709 | $346,000 | $103,800 | $242,200 |
| 2023 | $4,631 | $245,000 | $68,300 | $176,700 |
| 2022 | $4,535 | $245,000 | $68,300 | $176,700 |
| 2021 | $4,410 | $245,000 | $68,300 | $176,700 |
| 2020 | $4,443 | $213,900 | $65,100 | $148,800 |
| 2019 | $4,443 | $213,900 | $65,100 | $148,800 |
| 2018 | $4,340 | $213,900 | $65,100 | $148,800 |
| 2017 | $4,416 | $192,500 | $58,600 | $133,900 |
| 2016 | $4,322 | $192,500 | $58,600 | $133,900 |
| 2015 | $4,322 | $192,500 | $58,600 | $133,900 |
| 2014 | $4,139 | $181,200 | $58,600 | $122,600 |
Source: Public Records
Map
Nearby Homes
- 111 Belgium St
- 46 Roslyn Ave
- 69 W View Ave
- 99 Salem Ave
- 0 Rutland St
- 55 Columbus Blvd
- 446 Budlong Rd
- 10 Sheffield Rd
- 12 Stevens Rd
- 210 Hyde St
- 92 Rhode Island St
- 38 Brettonwoods Dr
- 140 Concord Ave
- 63 Packard St
- 141 Glen Ridge Rd
- 80 Packard St
- 130 Wollaston St
- 80 Phenix Ave
- 28 Hybrid Dr
- 34 Aldrich Ave