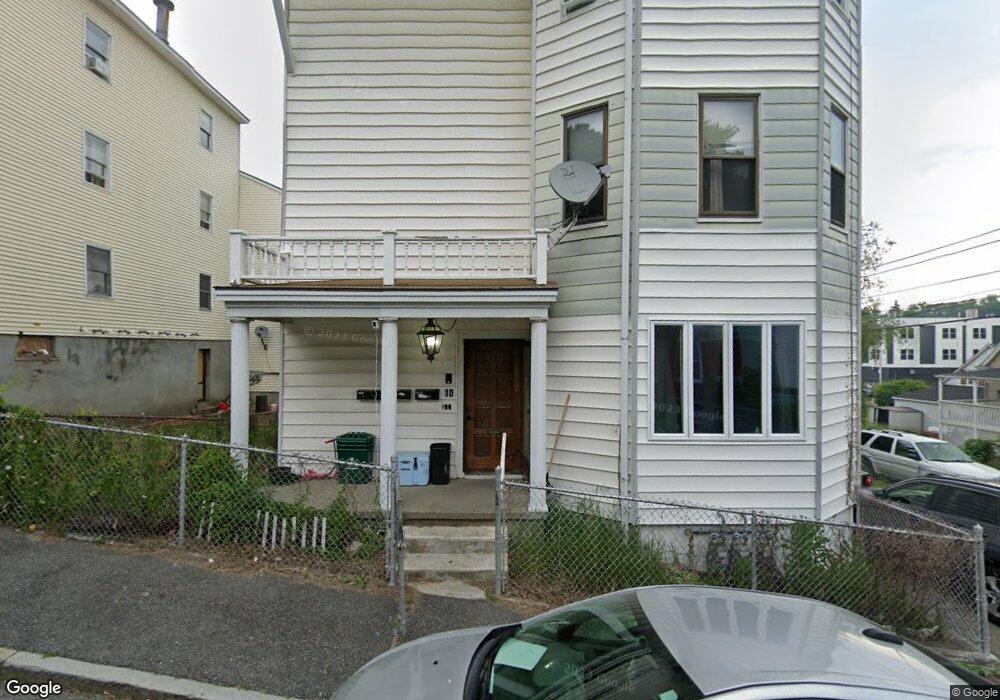
10 Marshall St Unit 3 Worcester, MA 01604
Shrewsbury Street NeighborhoodEstimated Value: $601,906 - $812,000
3
Beds
1
Bath
1,335
Sq Ft
$559/Sq Ft
Est. Value
About This Home
This home is located at 10 Marshall St Unit 3, Worcester, MA 01604 and is currently estimated at $746,727, approximately $559 per square foot. 10 Marshall St Unit 3 is a home located in Worcester County with nearby schools including City View, Jacob Hiatt Magnet School, and Chandler Magnet.
Ownership History
Date
Name
Owned For
Owner Type
Purchase Details
Closed on
Aug 23, 2018
Sold by
Bronzo Dennis and Bronzo Linda
Bought by
Sherman David
Current Estimated Value
Home Financials for this Owner
Home Financials are based on the most recent Mortgage that was taken out on this home.
Original Mortgage
$275,250
Outstanding Balance
$236,026
Interest Rate
4.5%
Mortgage Type
New Conventional
Estimated Equity
$510,701
Purchase Details
Closed on
Feb 18, 2005
Sold by
Ricchuti Rose
Bought by
Bronzo Dennis
Create a Home Valuation Report for This Property
The Home Valuation Report is an in-depth analysis detailing your home's value as well as a comparison with similar homes in the area
Home Values in the Area
Average Home Value in this Area
Purchase History
| Date | Buyer | Sale Price | Title Company |
|---|---|---|---|
| Sherman David | $367,000 | -- | |
| Bronzo Dennis | -- | -- |
Source: Public Records
Mortgage History
| Date | Status | Borrower | Loan Amount |
|---|---|---|---|
| Open | Sherman David | $275,250 |
Source: Public Records
Tax History
| Year | Tax Paid | Tax Assessment Tax Assessment Total Assessment is a certain percentage of the fair market value that is determined by local assessors to be the total taxable value of land and additions on the property. | Land | Improvement |
|---|---|---|---|---|
| 2025 | $9,225 | $699,400 | $81,200 | $618,200 |
| 2024 | $8,465 | $615,600 | $81,200 | $534,400 |
| 2023 | $8,125 | $566,600 | $70,600 | $496,000 |
| 2022 | $7,076 | $465,200 | $56,500 | $408,700 |
| 2021 | $6,263 | $384,700 | $45,200 | $339,500 |
| 2020 | $5,765 | $339,100 | $44,900 | $294,200 |
| 2019 | $4,219 | $234,400 | $39,200 | $195,200 |
| 2018 | $4,124 | $218,100 | $39,200 | $178,900 |
| 2017 | $3,867 | $201,200 | $39,200 | $162,000 |
| 2016 | $3,685 | $178,800 | $28,300 | $150,500 |
| 2015 | $3,589 | $178,800 | $28,300 | $150,500 |
| 2014 | $3,494 | $178,800 | $28,300 | $150,500 |
Source: Public Records
Map
Nearby Homes
Your Personal Tour Guide
Ask me questions while you tour the home.