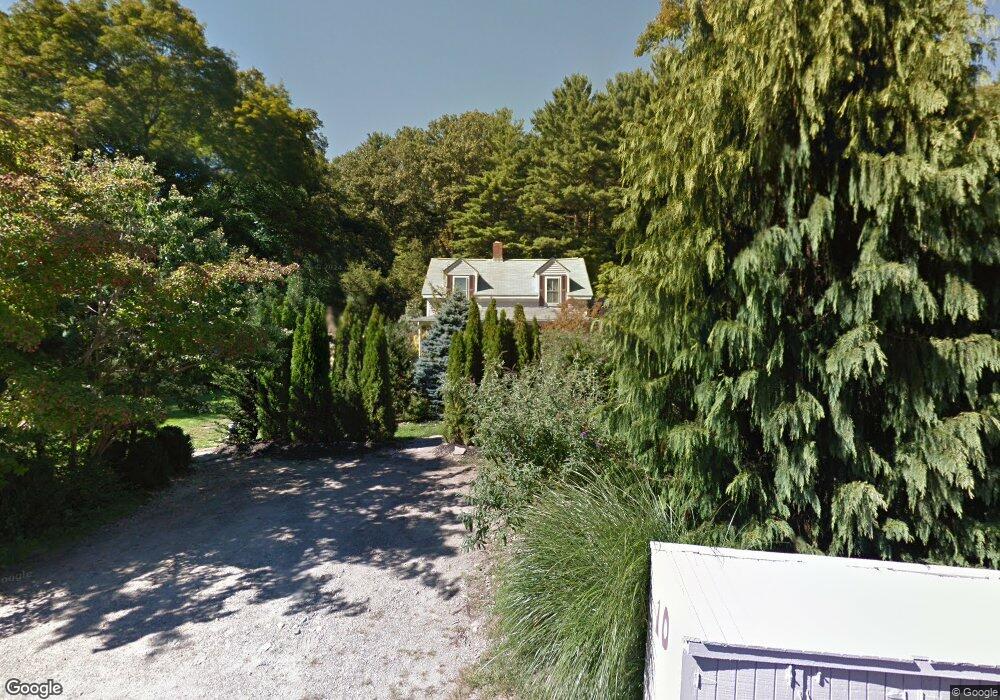
10 Matthew Ct Natick, MA 01760
Estimated Value: $633,000 - $768,000
2
Beds
1
Bath
993
Sq Ft
$710/Sq Ft
Est. Value
About This Home
This home is located at 10 Matthew Ct, Natick, MA 01760 and is currently estimated at $704,849, approximately $709 per square foot. 10 Matthew Ct is a home located in Middlesex County with nearby schools including Natick High School, Memorial Elementary School, and J F Kennedy Middle School.
Ownership History
Date
Name
Owned For
Owner Type
Purchase Details
Closed on
Jan 23, 2024
Sold by
Soper Walter and Fagan Elizabeth A
Bought by
Fagan Soper Ft and Soper
Current Estimated Value
Purchase Details
Closed on
Mar 12, 1992
Sold by
Baker David E and Baker Janet M
Bought by
Soper Walter and Fagan Ann C
Home Financials for this Owner
Home Financials are based on the most recent Mortgage that was taken out on this home.
Original Mortgage
$88,000
Interest Rate
8.64%
Mortgage Type
Purchase Money Mortgage
Create a Home Valuation Report for This Property
The Home Valuation Report is an in-depth analysis detailing your home's value as well as a comparison with similar homes in the area
Home Values in the Area
Average Home Value in this Area
Purchase History
| Date | Buyer | Sale Price | Title Company |
|---|---|---|---|
| Fagan Soper Ft | -- | None Available | |
| Soper Walter | $110,000 | -- |
Source: Public Records
Mortgage History
| Date | Status | Borrower | Loan Amount |
|---|---|---|---|
| Previous Owner | Soper Walter | $105,000 | |
| Previous Owner | Soper Walter | $88,000 | |
| Previous Owner | Soper Walter | $32,000 |
Source: Public Records
Tax History Compared to Growth
Tax History
| Year | Tax Paid | Tax Assessment Tax Assessment Total Assessment is a certain percentage of the fair market value that is determined by local assessors to be the total taxable value of land and additions on the property. | Land | Improvement |
|---|---|---|---|---|
| 2025 | $6,373 | $532,900 | $453,400 | $79,500 |
| 2024 | $6,166 | $502,900 | $428,200 | $74,700 |
| 2023 | $5,970 | $472,300 | $402,700 | $69,600 |
| 2022 | $5,251 | $393,600 | $367,200 | $26,400 |
| 2021 | $5,063 | $372,000 | $347,100 | $24,900 |
| 2020 | $4,857 | $356,900 | $332,000 | $24,900 |
| 2019 | $5,191 | $356,900 | $332,000 | $24,900 |
| 2018 | $4,963 | $353,900 | $316,900 | $37,000 |
| 2017 | $4,402 | $326,300 | $277,900 | $48,400 |
| 2016 | $4,264 | $314,200 | $266,200 | $48,000 |
| 2015 | $4,292 | $310,600 | $266,200 | $44,400 |
Source: Public Records
Map
Nearby Homes