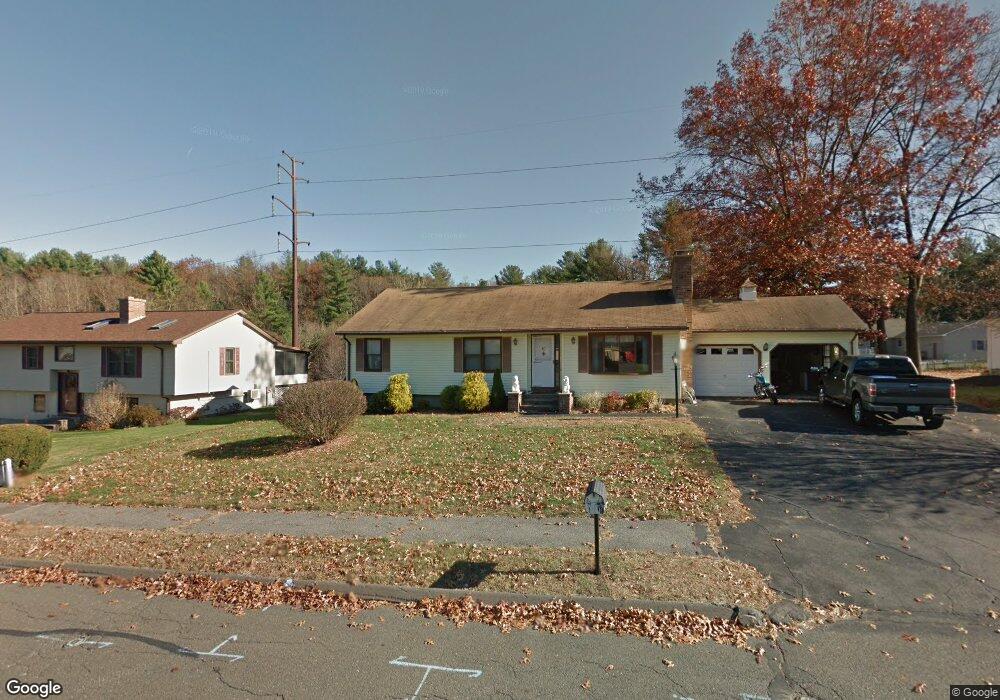
10 Matthew Dr Easthampton, MA 01027
Estimated Value: $390,000 - $465,000
3
Beds
4
Baths
1,283
Sq Ft
$338/Sq Ft
Est. Value
About This Home
This home is located at 10 Matthew Dr, Easthampton, MA 01027 and is currently estimated at $433,907, approximately $338 per square foot. 10 Matthew Dr is a home located in Hampshire County with nearby schools including Easthampton High School, Calvary Baptist Christian School, and Tri-County Schools.
Ownership History
Date
Name
Owned For
Owner Type
Purchase Details
Closed on
Jul 19, 1991
Sold by
Sylvester Paul
Bought by
Millette Chris J and Tracy J Millette
Current Estimated Value
Home Financials for this Owner
Home Financials are based on the most recent Mortgage that was taken out on this home.
Original Mortgage
$87,200
Interest Rate
9.36%
Mortgage Type
Purchase Money Mortgage
Purchase Details
Closed on
Sep 29, 1989
Sold by
Boyle James F
Bought by
Sylvester Paul
Home Financials for this Owner
Home Financials are based on the most recent Mortgage that was taken out on this home.
Original Mortgage
$119,786
Interest Rate
9.92%
Mortgage Type
Purchase Money Mortgage
Create a Home Valuation Report for This Property
The Home Valuation Report is an in-depth analysis detailing your home's value as well as a comparison with similar homes in the area
Home Values in the Area
Average Home Value in this Area
Purchase History
| Date | Buyer | Sale Price | Title Company |
|---|---|---|---|
| Millette Chris J | $109,000 | -- | |
| Sylvester Paul | $118,600 | -- |
Source: Public Records
Mortgage History
| Date | Status | Borrower | Loan Amount |
|---|---|---|---|
| Open | Sylvester Paul | $130,200 | |
| Closed | Sylvester Paul | $36,500 | |
| Closed | Sylvester Paul | $87,200 | |
| Previous Owner | Sylvester Paul | $119,786 |
Source: Public Records
Tax History
| Year | Tax Paid | Tax Assessment Tax Assessment Total Assessment is a certain percentage of the fair market value that is determined by local assessors to be the total taxable value of land and additions on the property. | Land | Improvement |
|---|---|---|---|---|
| 2025 | $6,037 | $0 | $0 | $0 |
| 2024 | $6,037 | $445,200 | $111,700 | $333,500 |
| 2023 | $4,522 | $308,700 | $88,100 | $220,600 |
| 2022 | $5,103 | $308,700 | $88,100 | $220,600 |
| 2021 | $5,922 | $319,500 | $88,100 | $231,400 |
| 2020 | $5,483 | $308,700 | $88,100 | $220,600 |
| 2019 | $4,445 | $287,500 | $88,100 | $199,400 |
| 2018 | $4,253 | $265,800 | $83,100 | $182,700 |
| 2017 | $4,158 | $256,500 | $80,000 | $176,500 |
| 2016 | $3,999 | $256,500 | $80,000 | $176,500 |
| 2015 | $3,886 | $256,500 | $80,000 | $176,500 |
Source: Public Records
Map
Nearby Homes
Your Personal Tour Guide
Ask me questions while you tour the home.