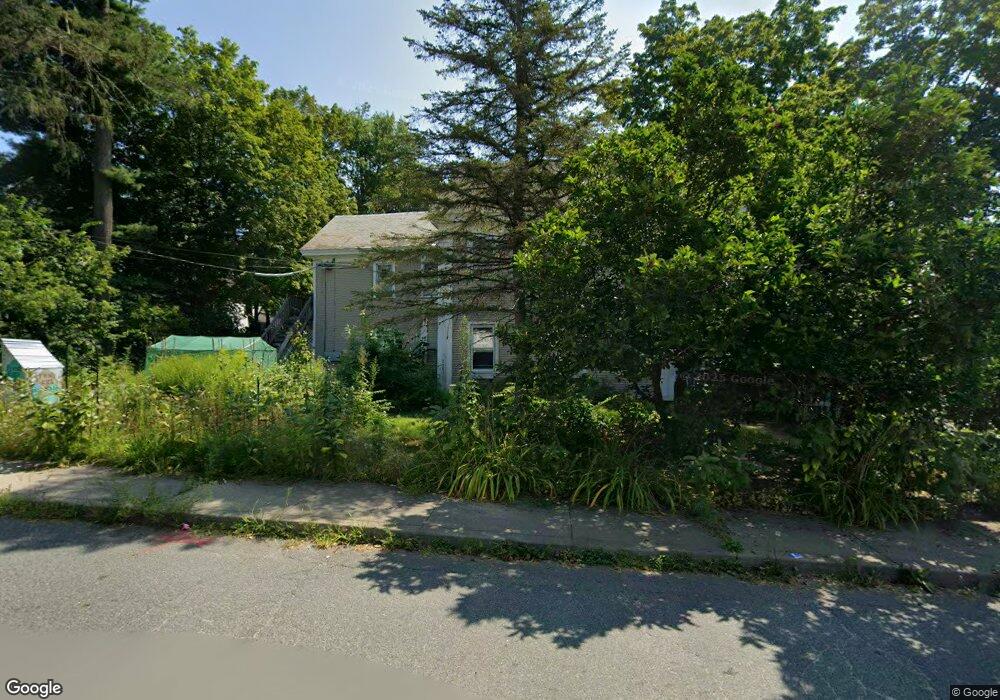
10 Mechanic St Orange, MA 01364
Estimated Value: $312,000 - $400,560
4
Beds
2
Baths
3,300
Sq Ft
$108/Sq Ft
Est. Value
About This Home
This home is located at 10 Mechanic St, Orange, MA 01364 and is currently estimated at $357,640, approximately $108 per square foot. 10 Mechanic St is a home located in Franklin County with nearby schools including Fisher Hill and Ralph C Mahar Regional School.
Ownership History
Date
Name
Owned For
Owner Type
Purchase Details
Closed on
Sep 16, 2009
Sold by
Paige Rosanne K
Bought by
Alan J Paige T and Paige Rosanne K
Current Estimated Value
Home Financials for this Owner
Home Financials are based on the most recent Mortgage that was taken out on this home.
Original Mortgage
$94,000
Interest Rate
5.43%
Purchase Details
Closed on
Jun 28, 1994
Sold by
Paradis Jodie J and Paradis Lawrence J
Bought by
Paige Rosanne K
Home Financials for this Owner
Home Financials are based on the most recent Mortgage that was taken out on this home.
Original Mortgage
$58,900
Interest Rate
8.74%
Mortgage Type
Purchase Money Mortgage
Create a Home Valuation Report for This Property
The Home Valuation Report is an in-depth analysis detailing your home's value as well as a comparison with similar homes in the area
Home Values in the Area
Average Home Value in this Area
Purchase History
| Date | Buyer | Sale Price | Title Company |
|---|---|---|---|
| Alan J Paige T | -- | -- | |
| Paige Rosanne K | $62,000 | -- |
Source: Public Records
Mortgage History
| Date | Status | Borrower | Loan Amount |
|---|---|---|---|
| Previous Owner | Paige Rosanne K | $94,000 | |
| Previous Owner | Paige Rosanne K | $58,900 |
Source: Public Records
Tax History
| Year | Tax Paid | Tax Assessment Tax Assessment Total Assessment is a certain percentage of the fair market value that is determined by local assessors to be the total taxable value of land and additions on the property. | Land | Improvement |
|---|---|---|---|---|
| 2025 | $66 | $403,100 | $32,300 | $370,800 |
| 2024 | $6,114 | $350,600 | $32,300 | $318,300 |
| 2023 | $5,438 | $302,800 | $29,100 | $273,700 |
| 2022 | $4,899 | $256,200 | $29,100 | $227,100 |
| 2021 | $4,577 | $228,300 | $47,400 | $180,900 |
| 2020 | $4,371 | $215,000 | $43,200 | $171,800 |
| 2019 | $4,304 | $191,100 | $37,400 | $153,700 |
| 2018 | $3,820 | $174,100 | $34,900 | $139,200 |
| 2017 | $3,696 | $174,100 | $34,900 | $139,200 |
| 2016 | $3,483 | $160,500 | $31,200 | $129,300 |
| 2015 | $3,190 | $153,600 | $33,200 | $120,400 |
| 2014 | $3,287 | $166,500 | $33,200 | $133,300 |
Source: Public Records
Map
Nearby Homes
- 58 E Main St
- 50 E Main St
- 12-14 E Main St
- 23 E Howe St
- 36 Summit St Unit A
- 36 Summit St Unit B
- 83 W Main St
- 35 Ball St
- 166-168 W Main St
- 56 Shelter St
- 39 Terrace St
- 222 W River St
- 270 S Main St
- 313-315 Walnut Hill Rd
- 549 E Main St
- 490 S Main St
- 00 S Main St
- 000 S Main St
- 0 Quabbin Blvd
- 216 Holtshire Rd
Your Personal Tour Guide
Ask me questions while you tour the home.