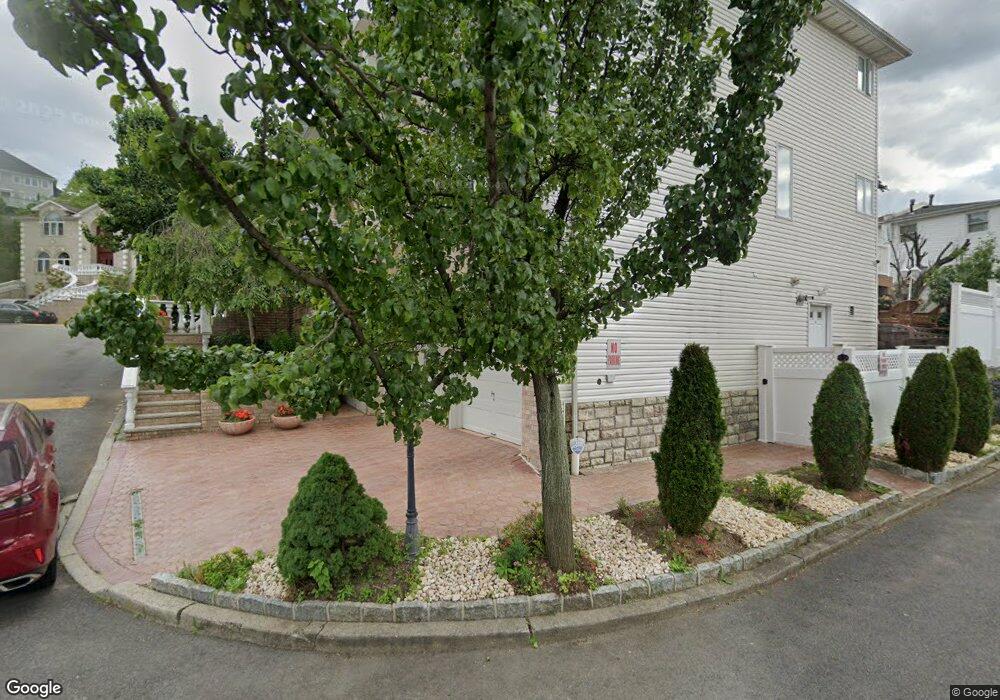
10 Michael Loop Staten Island, NY 10301
Emerson Hill NeighborhoodEstimated Value: $1,185,844 - $1,508,000
Studio
4
Baths
2,800
Sq Ft
$501/Sq Ft
Est. Value
About This Home
This home is located at 10 Michael Loop, Staten Island, NY 10301 and is currently estimated at $1,402,211, approximately $500 per square foot. 10 Michael Loop is a home located in Richmond County with nearby schools including P.S. 48 - William C. Wilcox, I.S. 49 Berta A Dreyfus, and New Dorp High School.
Ownership History
Date
Name
Owned For
Owner Type
Purchase Details
Closed on
Nov 28, 2012
Sold by
Yakub Iffraimov and Iffraimov Yakub
Bought by
Iffraimov Yakub
Current Estimated Value
Home Financials for this Owner
Home Financials are based on the most recent Mortgage that was taken out on this home.
Original Mortgage
$448,000
Outstanding Balance
$313,732
Interest Rate
3.6%
Mortgage Type
Adjustable Rate Mortgage/ARM
Estimated Equity
$1,088,479
Purchase Details
Closed on
Jan 31, 2002
Sold by
Block 836 Associates Llc
Bought by
Yakub Iffraimov and Iffraimov Yakub
Home Financials for this Owner
Home Financials are based on the most recent Mortgage that was taken out on this home.
Original Mortgage
$198,000
Interest Rate
6.84%
Mortgage Type
Credit Line Revolving
Create a Home Valuation Report for This Property
The Home Valuation Report is an in-depth analysis detailing your home's value as well as a comparison with similar homes in the area
Home Values in the Area
Average Home Value in this Area
Purchase History
| Date | Buyer | Sale Price | Title Company |
|---|---|---|---|
| Iffraimov Yakub | -- | The Security Title Guarantee | |
| Yakub Iffraimov | $713,000 | Lawyers Title Insurance Corp |
Source: Public Records
Mortgage History
| Date | Status | Borrower | Loan Amount |
|---|---|---|---|
| Open | Iffraimov Yakub | $448,000 | |
| Previous Owner | Yakub Iffraimov | $198,000 |
Source: Public Records
Tax History
| Year | Tax Paid | Tax Assessment Tax Assessment Total Assessment is a certain percentage of the fair market value that is determined by local assessors to be the total taxable value of land and additions on the property. | Land | Improvement |
|---|---|---|---|---|
| 2025 | $14,103 | $73,380 | $12,906 | $60,474 |
| 2024 | $14,115 | $77,220 | $12,131 | $65,089 |
| 2023 | $13,437 | $67,565 | $12,409 | $55,156 |
| 2022 | $12,745 | $65,280 | $13,080 | $52,200 |
| 2021 | $12,771 | $66,900 | $13,080 | $53,820 |
| 2020 | $12,475 | $64,020 | $13,080 | $50,940 |
| 2019 | $12,192 | $68,880 | $13,080 | $55,800 |
| 2018 | $11,180 | $56,304 | $12,045 | $44,259 |
| 2017 | $10,886 | $54,873 | $12,592 | $42,281 |
| 2016 | $10,039 | $51,768 | $12,267 | $39,501 |
| 2015 | $9,240 | $50,280 | $10,920 | $39,360 |
| 2014 | $9,240 | $49,735 | $9,650 | $40,085 |
Source: Public Records
Map
Nearby Homes
- 35 Milden Ave
- 74 Longfellow Ave
- 55 Nicole Loop
- 16 Diana Trail
- 79 Endor Ave
- 27 Witteman Place
- 260 Douglas Rd
- 174 Douglas Rd
- 25 Beebe St
- 197 Seneca Ave
- 76 Douglas Rd
- 159 Seneca Ave
- 1430 Clove Rd
- 755 Narrows Rd N Unit 602
- 755 Narrows Rd N Unit 513A
- 755 Narrows Rd N Unit 305
- 210 Spring St Unit 3
- 533 Ocean Terrace
- 1 Douglas Ct
- 830 Howard Ave Unit 3A
- 14 Michael Loop
- 0 Michael Loop
- 86 Michael Loop
- 71 Hewitt Ave
- 75 Hewitt Ave
- 77 Hewitt Ave
- 15 Michael Loop
- 79 Hewitt Ave
- 77 Michael Loop
- 77 Michael Loop Unit 52
- 18 Michael Loop Unit 22
- 18-22 Michael Loop
- 81 Hewitt Ave
- 61 Hewitt Ave
- 83 Hewitt Ave
- 29 Michael Loop
- 73 Michael Loop
- 82 Michael Loop
- 57 Hewitt Ave
- 87 Hewitt Ave
Your Personal Tour Guide
Ask me questions while you tour the home.