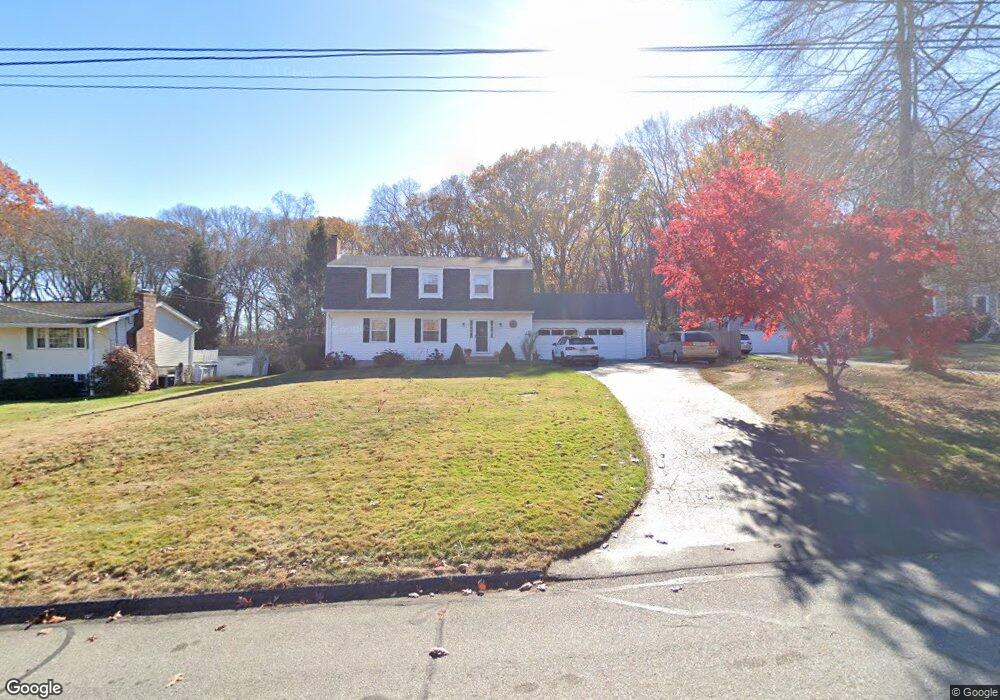
10 Mohawk Dr Niantic, CT 06357
Estimated Value: $608,000 - $721,000
4
Beds
3
Baths
2,160
Sq Ft
$304/Sq Ft
Est. Value
About This Home
This home is located at 10 Mohawk Dr, Niantic, CT 06357 and is currently estimated at $657,189, approximately $304 per square foot. 10 Mohawk Dr is a home located in New London County with nearby schools including East Lyme Middle School, East Lyme High School, and The Light House Voc-Ed Center.
Ownership History
Date
Name
Owned For
Owner Type
Purchase Details
Closed on
Dec 29, 2011
Sold by
Golden Hayley
Bought by
Healy Joseph William and Healy Nancy J
Current Estimated Value
Home Financials for this Owner
Home Financials are based on the most recent Mortgage that was taken out on this home.
Original Mortgage
$228,750
Outstanding Balance
$156,974
Interest Rate
4%
Mortgage Type
Purchase Money Mortgage
Estimated Equity
$500,215
Purchase Details
Closed on
Jul 1, 1991
Sold by
Amdur Dr Henry and Amdur Miriam
Bought by
Golden David and Golden Yael
Create a Home Valuation Report for This Property
The Home Valuation Report is an in-depth analysis detailing your home's value as well as a comparison with similar homes in the area
Home Values in the Area
Average Home Value in this Area
Purchase History
| Date | Buyer | Sale Price | Title Company |
|---|---|---|---|
| Healy Joseph William | $305,000 | -- | |
| Healy Joseph William | $305,000 | -- | |
| Golden David | $185,000 | -- |
Source: Public Records
Mortgage History
| Date | Status | Borrower | Loan Amount |
|---|---|---|---|
| Open | Golden David | $228,750 | |
| Closed | Golden David | $228,750 | |
| Previous Owner | Golden David | $202,000 |
Source: Public Records
Tax History
| Year | Tax Paid | Tax Assessment Tax Assessment Total Assessment is a certain percentage of the fair market value that is determined by local assessors to be the total taxable value of land and additions on the property. | Land | Improvement |
|---|---|---|---|---|
| 2025 | $6,541 | $233,520 | $89,810 | $143,710 |
| 2024 | $6,153 | $233,520 | $89,810 | $143,710 |
| 2023 | $5,810 | $233,520 | $89,810 | $143,710 |
| 2022 | $5,567 | $233,520 | $89,810 | $143,710 |
| 2021 | $5,670 | $198,870 | $85,680 | $113,190 |
| 2020 | $5,640 | $198,870 | $85,680 | $113,190 |
| 2019 | $5,606 | $198,870 | $85,680 | $113,190 |
| 2018 | $5,439 | $198,870 | $85,680 | $113,190 |
| 2017 | $5,202 | $198,870 | $85,680 | $113,190 |
| 2016 | $5,381 | $212,170 | $106,050 | $106,120 |
| 2015 | $5,243 | $212,170 | $106,050 | $106,120 |
| 2014 | $5,098 | $212,170 | $106,050 | $106,120 |
Source: Public Records
Map
Nearby Homes
- 36 Attawan Rd
- 26 Mohawk Dr
- 127 Black Point Rd Unit 7
- 61 Whitecap Rd
- 42 S Washington Ave
- 19 Sapia Dr
- 12 Spinnaker Dr
- 15 Griswold Rd
- 468 Main St Unit 318
- 468 Main St Unit 111
- 43 Village Crossing Unit 43
- 47 Village Crossing Unit 47
- 18 Compass Ct
- 31 Regatta Dr
- 46 Village Crossing Unit 46
- 97 W Main St Unit 36
- 55 Corey Ln
- 43 Roxbury Ct
- 185 Main St Unit 301
- 185 Main St Unit 305
Your Personal Tour Guide
Ask me questions while you tour the home.