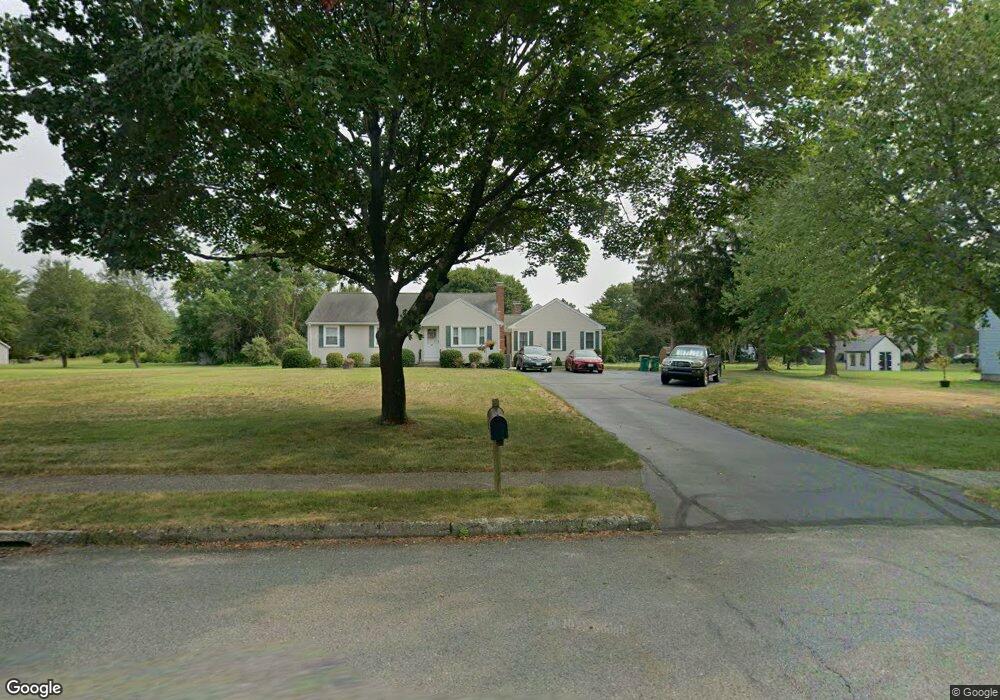
10 Morgan Rd Mansfield, MA 02048
Estimated Value: $720,000 - $842,000
5
Beds
2
Baths
2,368
Sq Ft
$332/Sq Ft
Est. Value
About This Home
This home is located at 10 Morgan Rd, Mansfield, MA 02048 and is currently estimated at $785,561, approximately $331 per square foot. 10 Morgan Rd is a home located in Bristol County with nearby schools including Everett W. Robinson Elementary School, Jordan/Jackson Elementary School, and Harold L. Qualters Middle School.
Ownership History
Date
Name
Owned For
Owner Type
Purchase Details
Closed on
Feb 19, 2008
Sold by
Adie William A and Adie Alice M
Bought by
Brotherton Karen A and Adie Andrea A
Current Estimated Value
Create a Home Valuation Report for This Property
The Home Valuation Report is an in-depth analysis detailing your home's value as well as a comparison with similar homes in the area
Home Values in the Area
Average Home Value in this Area
Purchase History
| Date | Buyer | Sale Price | Title Company |
|---|---|---|---|
| Brotherton Karen A | -- | -- |
Source: Public Records
Tax History
| Year | Tax Paid | Tax Assessment Tax Assessment Total Assessment is a certain percentage of the fair market value that is determined by local assessors to be the total taxable value of land and additions on the property. | Land | Improvement |
|---|---|---|---|---|
| 2025 | $8,624 | $654,800 | $266,000 | $388,800 |
| 2024 | $7,723 | $572,100 | $253,900 | $318,200 |
| 2023 | $7,503 | $532,500 | $253,900 | $278,600 |
| 2022 | $7,210 | $475,300 | $235,000 | $240,300 |
| 2021 | $7,531 | $490,300 | $223,900 | $266,400 |
| 2020 | $6,981 | $454,500 | $195,900 | $258,600 |
| 2019 | $6,972 | $458,100 | $186,500 | $271,600 |
| 2018 | $6,511 | $418,200 | $177,800 | $240,400 |
| 2017 | $6,402 | $426,200 | $172,800 | $253,400 |
| 2016 | $6,320 | $410,100 | $164,500 | $245,600 |
| 2015 | $5,754 | $371,200 | $164,500 | $206,700 |
Source: Public Records
Map
Nearby Homes
- 24 Maverick Dr
- 25 Shepherd St
- 128 Tremont St
- 17 Childs Ln
- 150 Gilbert St
- 9 Coach Rd
- 84 Messenger St
- 25 Munroe Dr
- 40 Treasure Island Rd
- 33 Colonial Way
- 16 Treasure Island Rd
- 14 Claire Ave
- 401 South St
- 1769 West St
- 46 Mirimichi St
- 38 Mirimichi St
- 28 Messenger St
- 346 South St
- 57 Vine St
- 115 Westfield Dr
Your Personal Tour Guide
Ask me questions while you tour the home.