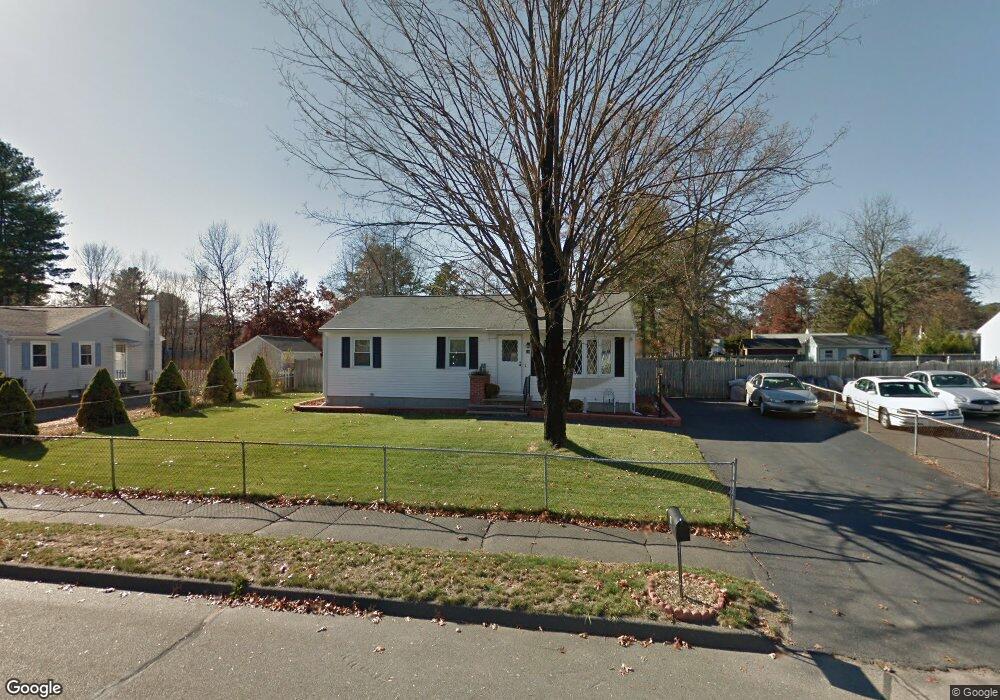
10 Morin Dr Easthampton, MA 01027
Estimated Value: $330,000 - $356,000
3
Beds
2
Baths
960
Sq Ft
$360/Sq Ft
Est. Value
About This Home
This home is located at 10 Morin Dr, Easthampton, MA 01027 and is currently estimated at $345,670, approximately $360 per square foot. 10 Morin Dr is a home located in Hampshire County with nearby schools including Easthampton High School, Calvary Baptist Christian School, and Tri-County Schools.
Ownership History
Date
Name
Owned For
Owner Type
Purchase Details
Closed on
Oct 19, 2009
Sold by
Blair William J and Labonte Nancy A
Bought by
Blair James and Blair Marion T
Current Estimated Value
Home Financials for this Owner
Home Financials are based on the most recent Mortgage that was taken out on this home.
Original Mortgage
$100,000
Interest Rate
5.14%
Mortgage Type
Purchase Money Mortgage
Purchase Details
Closed on
Jun 20, 2003
Sold by
Blair Marion T and Blair William I
Bought by
Blair James and Labonte Nancy A
Create a Home Valuation Report for This Property
The Home Valuation Report is an in-depth analysis detailing your home's value as well as a comparison with similar homes in the area
Home Values in the Area
Average Home Value in this Area
Purchase History
| Date | Buyer | Sale Price | Title Company |
|---|---|---|---|
| Blair James | $120,000 | -- | |
| Blair James | -- | -- |
Source: Public Records
Mortgage History
| Date | Status | Borrower | Loan Amount |
|---|---|---|---|
| Open | Blair James | $99,000 | |
| Closed | Blair James | $100,000 |
Source: Public Records
Tax History
| Year | Tax Paid | Tax Assessment Tax Assessment Total Assessment is a certain percentage of the fair market value that is determined by local assessors to be the total taxable value of land and additions on the property. | Land | Improvement |
|---|---|---|---|---|
| 2025 | $4,526 | $331,100 | $118,300 | $212,800 |
| 2024 | $4,369 | $322,200 | $114,900 | $207,300 |
| 2023 | $3,320 | $226,600 | $90,400 | $136,200 |
| 2022 | $3,746 | $226,600 | $90,400 | $136,200 |
| 2021 | $4,096 | $233,500 | $90,400 | $143,100 |
| 2020 | $4,024 | $226,600 | $90,400 | $136,200 |
| 2019 | $3,376 | $218,400 | $90,400 | $128,000 |
| 2018 | $3,349 | $209,300 | $85,400 | $123,900 |
| 2017 | $3,270 | $201,700 | $82,100 | $119,600 |
| 2016 | $3,145 | $201,700 | $82,100 | $119,600 |
| 2015 | $3,056 | $201,700 | $82,100 | $119,600 |
Source: Public Records
Map
Nearby Homes
Your Personal Tour Guide
Ask me questions while you tour the home.