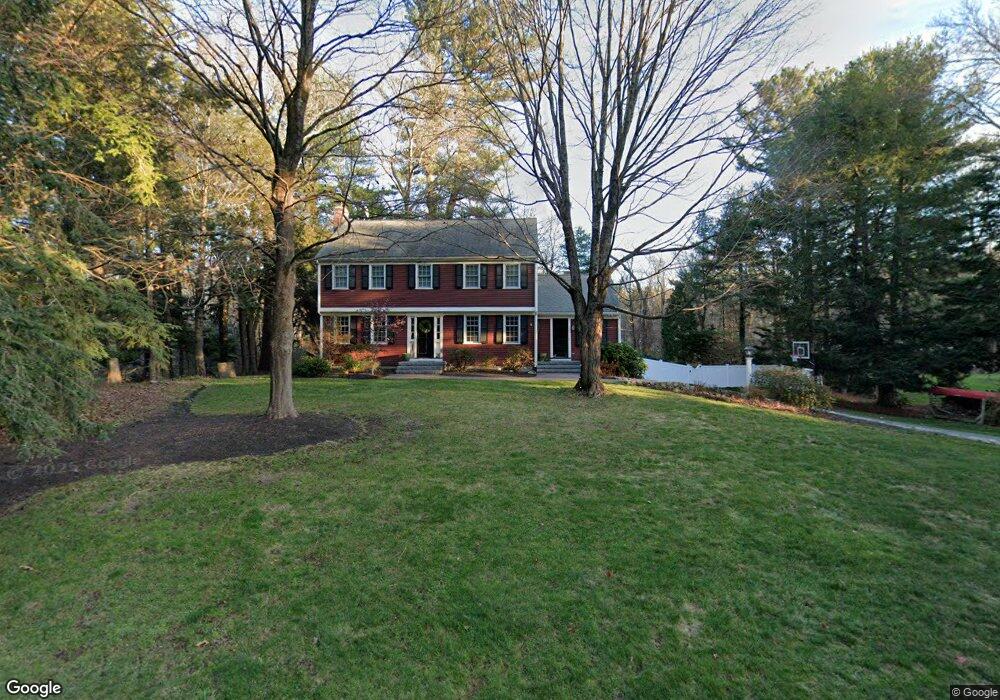
10 Morse Rd Sherborn, MA 01770
Estimated Value: $1,332,780 - $1,601,000
4
Beds
3
Baths
2,500
Sq Ft
$569/Sq Ft
Est. Value
About This Home
This home is located at 10 Morse Rd, Sherborn, MA 01770 and is currently estimated at $1,422,945, approximately $569 per square foot. 10 Morse Rd is a home located in Middlesex County with nearby schools including Pine Hill Elementary School, Dover-Sherborn Regional Middle School, and Dover-Sherborn Regional High School.
Ownership History
Date
Name
Owned For
Owner Type
Purchase Details
Closed on
Jul 15, 2008
Sold by
Smith James and Smith Nora Lynch
Bought by
Pinsky Caroline and Conlow George John
Current Estimated Value
Home Financials for this Owner
Home Financials are based on the most recent Mortgage that was taken out on this home.
Original Mortgage
$556,000
Outstanding Balance
$350,409
Interest Rate
6.13%
Mortgage Type
Purchase Money Mortgage
Estimated Equity
$1,072,536
Create a Home Valuation Report for This Property
The Home Valuation Report is an in-depth analysis detailing your home's value as well as a comparison with similar homes in the area
Home Values in the Area
Average Home Value in this Area
Purchase History
| Date | Buyer | Sale Price | Title Company |
|---|---|---|---|
| Pinsky Caroline | $786,300 | -- |
Source: Public Records
Mortgage History
| Date | Status | Borrower | Loan Amount |
|---|---|---|---|
| Open | Pinsky Caroline | $556,000 |
Source: Public Records
Tax History
| Year | Tax Paid | Tax Assessment Tax Assessment Total Assessment is a certain percentage of the fair market value that is determined by local assessors to be the total taxable value of land and additions on the property. | Land | Improvement |
|---|---|---|---|---|
| 2025 | $20,682 | $1,247,400 | $459,000 | $788,400 |
| 2024 | $18,457 | $1,088,900 | $406,800 | $682,100 |
| 2023 | $16,591 | $921,200 | $406,800 | $514,400 |
| 2022 | $15,332 | $805,700 | $396,200 | $409,500 |
| 2021 | $15,209 | $774,800 | $396,200 | $378,600 |
| 2020 | $15,078 | $774,800 | $396,200 | $378,600 |
| 2019 | $15,109 | $770,100 | $396,200 | $373,900 |
| 2018 | $14,633 | $758,200 | $396,200 | $362,000 |
| 2017 | $14,508 | $709,100 | $396,200 | $312,900 |
| 2016 | $14,438 | $701,900 | $396,200 | $305,700 |
| 2015 | $13,968 | $687,400 | $383,200 | $304,200 |
| 2014 | $13,439 | $660,700 | $371,200 | $289,500 |
Source: Public Records
Map
Nearby Homes
- 124 Everett St
- 13 Morgan Dr Unit 109
- 6 Hopewell Farm Rd
- 17 Morgan Dr Unit 204
- 11 Wyndemere Ln
- 17 Wyndemere Ln
- 7 Allison Way Unit 7
- 7 Morgan Dr Unit 203
- 303 Eliot St
- 137 Lake St
- 8 Washington St
- 63 Farm Road Lot 5
- 30 Sienna Ln Unit 30
- 5 Farm Rd
- 1 Fern St
- 14 Sewall Brook Ln
- 216-218 S Main St
- 41 Ivy Ln
- 8 Hudson St
- 75 Cottage St
Your Personal Tour Guide
Ask me questions while you tour the home.