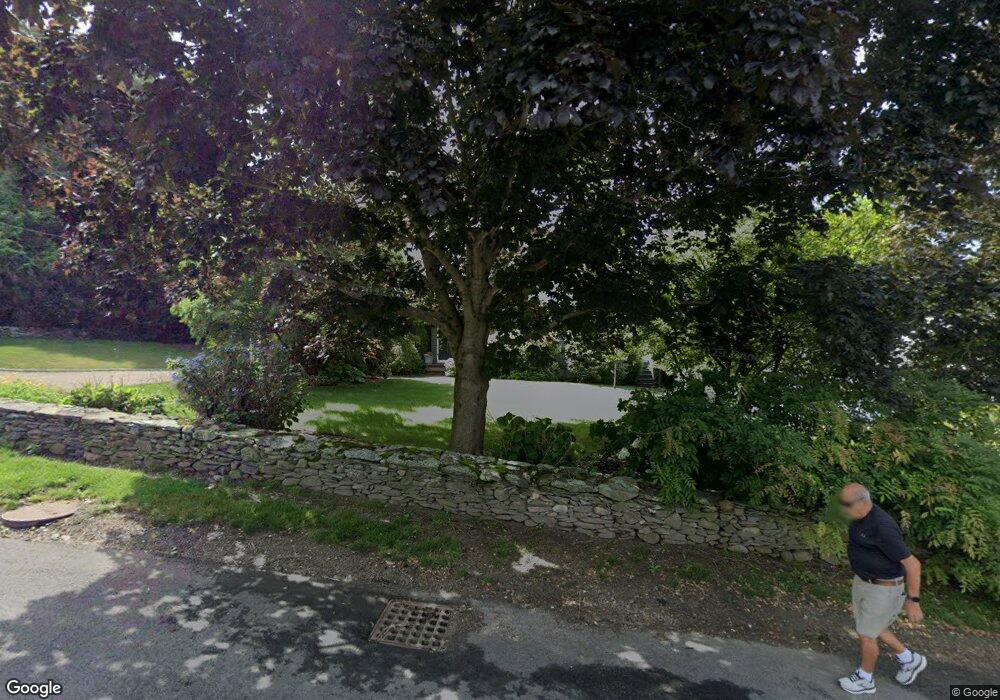
10 Mulberry Rd Bristol, RI 02809
Bristol Highlands NeighborhoodEstimated Value: $1,249,467 - $1,732,000
5
Beds
4
Baths
4,081
Sq Ft
$355/Sq Ft
Est. Value
About This Home
This home is located at 10 Mulberry Rd, Bristol, RI 02809 and is currently estimated at $1,449,867, approximately $355 per square foot. 10 Mulberry Rd is a home located in Bristol County with nearby schools including Mt. Hope High School, Highlander Charter Middle and High School, and Our Lady of Mt. Carmel School.
Ownership History
Date
Name
Owned For
Owner Type
Purchase Details
Closed on
Jul 20, 2004
Sold by
Raley David and Raley Shirley
Bought by
Wheeler Edward and Wheeler Jessica
Current Estimated Value
Home Financials for this Owner
Home Financials are based on the most recent Mortgage that was taken out on this home.
Original Mortgage
$235,000
Interest Rate
6.25%
Mortgage Type
Purchase Money Mortgage
Purchase Details
Closed on
Jun 26, 1998
Sold by
Duggan Richard W and Cleve Ragan P
Bought by
Raley David J and Raley Shirley
Purchase Details
Closed on
Apr 15, 1994
Sold by
Raiola Pasquale J and Raiola Dianne
Bought by
Duggan Richard W and Duggan Cleve
Home Financials for this Owner
Home Financials are based on the most recent Mortgage that was taken out on this home.
Original Mortgage
$213,300
Interest Rate
7.45%
Create a Home Valuation Report for This Property
The Home Valuation Report is an in-depth analysis detailing your home's value as well as a comparison with similar homes in the area
Home Values in the Area
Average Home Value in this Area
Purchase History
| Date | Buyer | Sale Price | Title Company |
|---|---|---|---|
| Wheeler Edward | $825,000 | -- | |
| Raley David J | $420,000 | -- | |
| Duggan Richard W | $237,000 | -- |
Source: Public Records
Mortgage History
| Date | Status | Borrower | Loan Amount |
|---|---|---|---|
| Closed | Duggan Richard W | $157,700 | |
| Closed | Duggan Richard W | $10,000 | |
| Closed | Duggan Richard W | $235,000 | |
| Previous Owner | Duggan Richard W | $213,300 |
Source: Public Records
Tax History
| Year | Tax Paid | Tax Assessment Tax Assessment Total Assessment is a certain percentage of the fair market value that is determined by local assessors to be the total taxable value of land and additions on the property. | Land | Improvement |
|---|---|---|---|---|
| 2025 | $12,151 | $879,200 | $255,900 | $623,300 |
| 2024 | $12,151 | $879,200 | $255,900 | $623,300 |
| 2023 | $11,746 | $879,200 | $255,900 | $623,300 |
| 2022 | $11,430 | $879,200 | $255,900 | $623,300 |
| 2021 | $11,278 | $784,300 | $254,300 | $530,000 |
| 2020 | $11,035 | $784,300 | $254,300 | $530,000 |
| 2019 | $10,761 | $784,300 | $254,300 | $530,000 |
| 2018 | $12,833 | $834,400 | $256,000 | $578,400 |
| 2017 | $9,259 | $620,600 | $231,200 | $389,400 |
| 2016 | $9,166 | $620,600 | $231,200 | $389,400 |
| 2015 | $8,491 | $605,200 | $231,200 | $374,000 |
| 2014 | $8,503 | $651,110 | $304,400 | $346,710 |
Source: Public Records
Map
Nearby Homes
- 29 Forest Rd
- 1 Hydraulion Ave
- 0 Surf Dr
- 1220 Hope St
- 1 Knowlton Ct
- 3 Knowlton Ct
- 7 Knowlton Ct
- 5 Knowlton Ct
- 1270 Hope St
- 35 Seabreeze Ln
- 506 Clarks Row
- 461 North Ln
- 417 North Ln
- 1382 Hope St
- 669 Metacom Ave Unit 25
- 2 Bagy Wrinkle Cove
- 677 Metacom Ave Unit 64
- 413 High St
- 556 Metacom Ave
- 85 Bay View Ave Unit 3
Your Personal Tour Guide
Ask me questions while you tour the home.