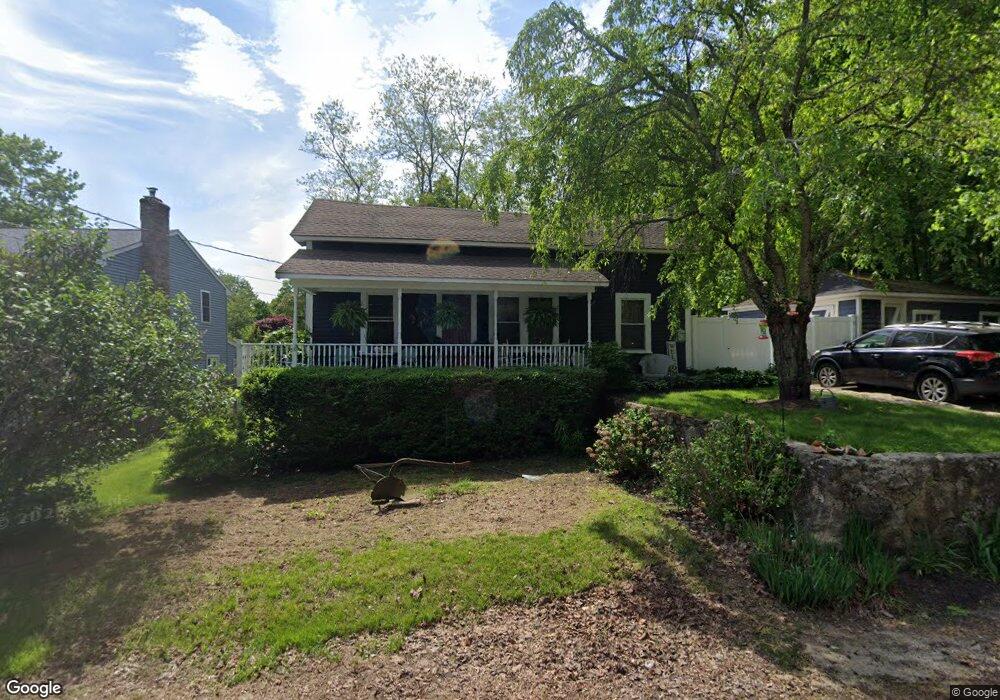
10 Mumford St Coventry, RI 02816
Estimated Value: $398,000 - $400,000
4
Beds
1
Bath
1,666
Sq Ft
$239/Sq Ft
Est. Value
About This Home
This home is located at 10 Mumford St, Coventry, RI 02816 and is currently estimated at $398,772, approximately $239 per square foot. 10 Mumford St is a home located in Kent County with nearby schools including Alan Shawn Feinstein Ms Of Cov, Coventry High School, and St Joseph School.
Ownership History
Date
Name
Owned For
Owner Type
Purchase Details
Closed on
Feb 28, 2003
Sold by
Potter William D
Bought by
Gareau Raymond E
Current Estimated Value
Home Financials for this Owner
Home Financials are based on the most recent Mortgage that was taken out on this home.
Original Mortgage
$143,100
Interest Rate
5.98%
Create a Home Valuation Report for This Property
The Home Valuation Report is an in-depth analysis detailing your home's value as well as a comparison with similar homes in the area
Purchase History
| Date | Buyer | Sale Price | Title Company |
|---|---|---|---|
| Gareau Raymond E | $159,000 | -- |
Source: Public Records
Mortgage History
| Date | Status | Borrower | Loan Amount |
|---|---|---|---|
| Open | Gareau Raymond E | $122,000 | |
| Closed | Gareau Raymond E | $133,000 | |
| Closed | Gareau Raymond E | $143,100 | |
| Previous Owner | Gareau Raymond E | $74,250 |
Source: Public Records
Tax History
| Year | Tax Paid | Tax Assessment Tax Assessment Total Assessment is a certain percentage of the fair market value that is determined by local assessors to be the total taxable value of land and additions on the property. | Land | Improvement |
|---|---|---|---|---|
| 2025 | $4,922 | $305,900 | $118,000 | $187,900 |
| 2024 | $4,845 | $305,900 | $118,000 | $187,900 |
| 2023 | $4,689 | $305,900 | $118,000 | $187,900 |
| 2022 | $4,963 | $253,600 | $115,400 | $138,200 |
| 2021 | $4,920 | $253,600 | $115,400 | $138,200 |
| 2020 | $5,640 | $253,600 | $115,400 | $138,200 |
| 2019 | $4,717 | $212,100 | $87,900 | $124,200 |
| 2018 | $4,583 | $212,100 | $87,900 | $124,200 |
| 2017 | $4,450 | $212,100 | $87,900 | $124,200 |
| 2016 | $4,196 | $196,000 | $86,400 | $109,600 |
| 2015 | $4,083 | $196,000 | $86,400 | $109,600 |
| 2014 | $3,997 | $196,000 | $86,400 | $109,600 |
| 2013 | $4,044 | $216,700 | $108,100 | $108,600 |
Source: Public Records
Map
Nearby Homes
Your Personal Tour Guide
Ask me questions while you tour the home.