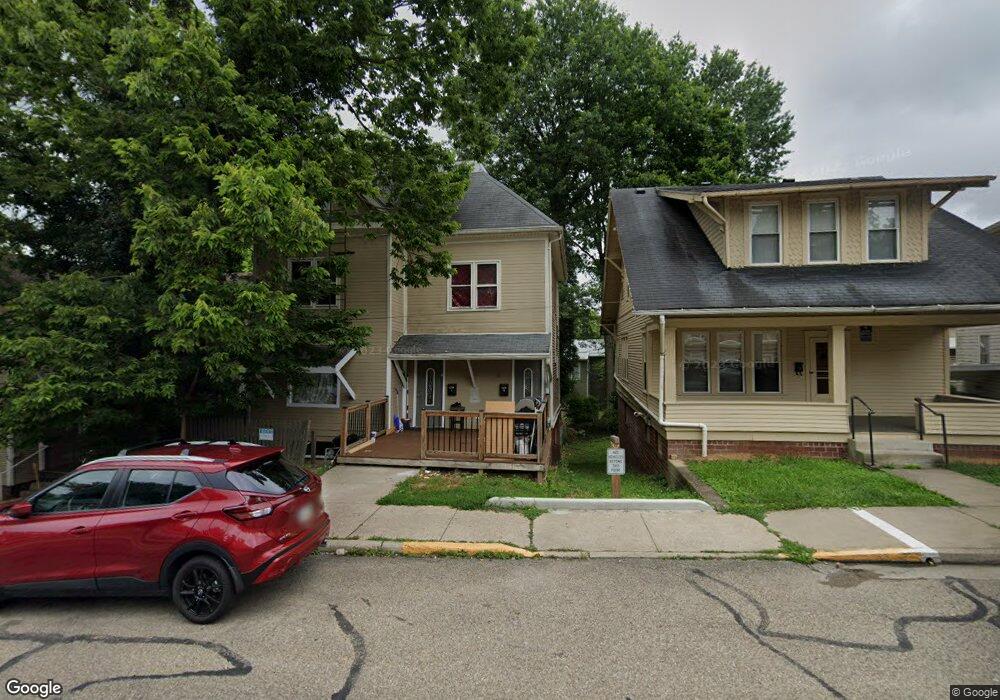
10 N Lancaster St Athens, OH 45701
Estimated Value: $303,000 - $413,123
6
Beds
2
Baths
2,988
Sq Ft
$122/Sq Ft
Est. Value
About This Home
This home is located at 10 N Lancaster St, Athens, OH 45701 and is currently estimated at $363,281, approximately $121 per square foot. 10 N Lancaster St is a home located in Athens County with nearby schools including West Elementary School, Athens Middle School, and Athens High School.
Ownership History
Date
Name
Owned For
Owner Type
Purchase Details
Closed on
Sep 28, 2022
Sold by
Cranberry Row Llc
Bought by
Linzheng Llc
Current Estimated Value
Home Financials for this Owner
Home Financials are based on the most recent Mortgage that was taken out on this home.
Original Mortgage
$168,750
Outstanding Balance
$154,319
Interest Rate
5.66%
Mortgage Type
New Conventional
Estimated Equity
$208,962
Purchase Details
Closed on
Aug 13, 2010
Sold by
K C K Rentals Llc
Bought by
Cranberry Row Llc
Home Financials for this Owner
Home Financials are based on the most recent Mortgage that was taken out on this home.
Original Mortgage
$193,125
Interest Rate
4.58%
Mortgage Type
Future Advance Clause Open End Mortgage
Purchase Details
Closed on
Apr 22, 2004
Sold by
Kemplin Ronald
Bought by
K.C.K.Rentals Llc
Purchase Details
Closed on
Aug 20, 1993
Sold by
Weilbacher Thomas Q
Bought by
Kemplin Ronald
Purchase Details
Closed on
Jun 1, 1990
Create a Home Valuation Report for This Property
The Home Valuation Report is an in-depth analysis detailing your home's value as well as a comparison with similar homes in the area
Home Values in the Area
Average Home Value in this Area
Purchase History
| Date | Buyer | Sale Price | Title Company |
|---|---|---|---|
| Linzheng Llc | -- | -- | |
| Cranberry Row Llc | $250,000 | Attorney | |
| K.C.K.Rentals Llc | -- | -- | |
| Kemplin Ronald | $76,000 | -- | |
| -- | $73,000 | -- |
Source: Public Records
Mortgage History
| Date | Status | Borrower | Loan Amount |
|---|---|---|---|
| Open | Linzheng Llc | $168,750 | |
| Previous Owner | Cranberry Row Llc | $193,125 |
Source: Public Records
Tax History Compared to Growth
Tax History
| Year | Tax Paid | Tax Assessment Tax Assessment Total Assessment is a certain percentage of the fair market value that is determined by local assessors to be the total taxable value of land and additions on the property. | Land | Improvement |
|---|---|---|---|---|
| 2024 | $5,748 | $106,640 | $8,910 | $97,730 |
| 2023 | $5,393 | $106,640 | $8,910 | $97,730 |
| 2022 | $4,512 | $85,260 | $8,910 | $76,350 |
| 2021 | $4,531 | $85,260 | $8,910 | $76,350 |
| 2020 | $4,405 | $85,260 | $8,910 | $76,350 |
| 2019 | $4,283 | $81,960 | $7,990 | $73,970 |
| 2018 | $4,229 | $81,960 | $7,990 | $73,970 |
| 2017 | $7,299 | $81,960 | $7,990 | $73,970 |
| 2016 | $3,747 | $75,060 | $7,610 | $67,450 |
| 2015 | $6,855 | $75,060 | $7,610 | $67,450 |
| 2014 | $6,855 | $75,060 | $7,610 | $67,450 |
| 2013 | $7,776 | $87,500 | $17,500 | $70,000 |
Source: Public Records
Map
Nearby Homes
- 71 W Washington St
- 80 Court
- 12 Walker St
- 11 Walker St
- 31 1st St
- 0 Roberts St
- 7 Elizabeth Dr
- 10 1st St
- 64 Franklin Ave
- 214 W State St
- 17 Ring St
- 193 N Lancaster St
- 56.15/15.5 Central & Clark
- 131 Grosvenor St
- 98 Central Ave
- 15 S Shafer St Unit 1509
- 18 Clarke St
- 273 E State St
- 12 McGuffey Ln
- 8181 Dairy Ln