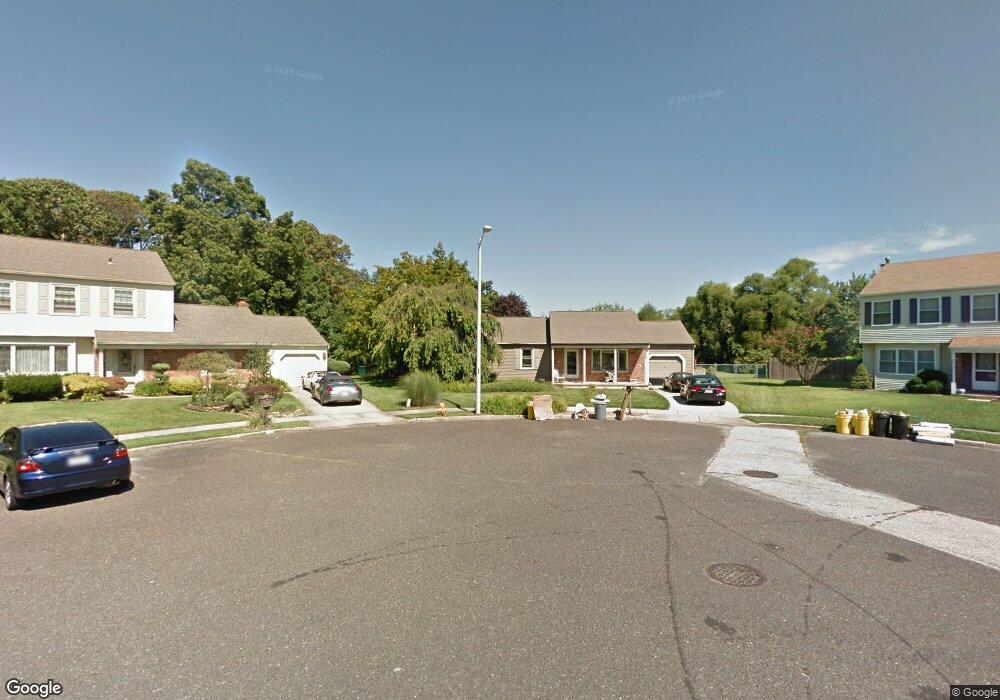
10 N Mars Ct Sewell, NJ 08080
Estimated Value: $321,178 - $384,000
Studio
--
Bath
1,317
Sq Ft
$267/Sq Ft
Est. Value
About This Home
This home is located at 10 N Mars Ct, Sewell, NJ 08080 and is currently estimated at $351,545, approximately $266 per square foot. 10 N Mars Ct is a home located in Gloucester County with nearby schools including Washington Township High School, Thomas Jefferson Elementary School, and Orchard Valley Middle School.
Ownership History
Date
Name
Owned For
Owner Type
Purchase Details
Closed on
Jul 28, 2016
Sold by
Brunetti Nicole
Bought by
Muller Andrea M
Current Estimated Value
Home Financials for this Owner
Home Financials are based on the most recent Mortgage that was taken out on this home.
Original Mortgage
$142,025
Outstanding Balance
$113,319
Interest Rate
3.48%
Mortgage Type
New Conventional
Estimated Equity
$238,226
Purchase Details
Closed on
Mar 28, 1985
Bought by
Gardner Donald L and Gardner Sharon M
Create a Home Valuation Report for This Property
The Home Valuation Report is an in-depth analysis detailing your home's value as well as a comparison with similar homes in the area
Home Values in the Area
Average Home Value in this Area
Purchase History
| Date | Buyer | Sale Price | Title Company |
|---|---|---|---|
| Muller Andrea M | $149,500 | Chicago Title Ins Co | |
| Gardner Donald L | $67,500 | -- |
Source: Public Records
Mortgage History
| Date | Status | Borrower | Loan Amount |
|---|---|---|---|
| Open | Muller Andrea M | $142,025 |
Source: Public Records
Tax History
| Year | Tax Paid | Tax Assessment Tax Assessment Total Assessment is a certain percentage of the fair market value that is determined by local assessors to be the total taxable value of land and additions on the property. | Land | Improvement |
|---|---|---|---|---|
| 2025 | $8,186 | $221,300 | $60,700 | $160,600 |
| 2024 | $7,956 | $221,300 | $60,700 | $160,600 |
| 2023 | $7,956 | $221,300 | $60,700 | $160,600 |
| 2022 | $7,695 | $221,300 | $60,700 | $160,600 |
| 2021 | $5,482 | $221,300 | $60,700 | $160,600 |
| 2020 | $7,482 | $221,300 | $60,700 | $160,600 |
| 2019 | $6,995 | $191,900 | $41,900 | $150,000 |
| 2018 | $6,916 | $191,900 | $41,900 | $150,000 |
| 2017 | $6,830 | $191,900 | $41,900 | $150,000 |
| 2016 | $6,539 | $191,900 | $41,900 | $150,000 |
| 2015 | $6,443 | $191,900 | $41,900 | $150,000 |
| 2014 | $6,232 | $191,900 | $41,900 | $150,000 |
Source: Public Records
Map
Nearby Homes
Your Personal Tour Guide
Ask me questions while you tour the home.