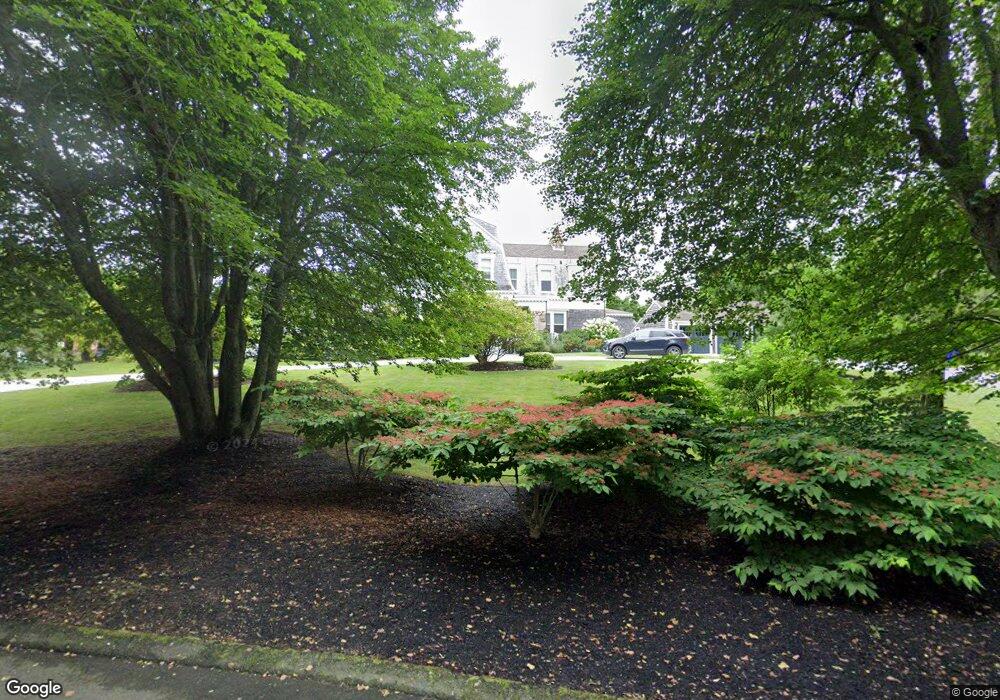
10 Nairn Rd Bourne, MA 02559
Pocasset NeighborhoodEstimated Value: $2,315,000 - $3,123,000
8
Beds
6
Baths
3,201
Sq Ft
$874/Sq Ft
Est. Value
About This Home
This home is located at 10 Nairn Rd, Bourne, MA 02559 and is currently estimated at $2,796,604, approximately $873 per square foot. 10 Nairn Rd is a home located in Barnstable County with nearby schools including Bourne High School, Cadence Academy Preschool - Bourne, and Heritage Christian Academy.
Ownership History
Date
Name
Owned For
Owner Type
Purchase Details
Closed on
Jul 13, 2022
Sold by
Langston John R and Finnerty-Langston Lisa A
Bought by
Cassi Ward Power T and Cassi Ward-Power
Current Estimated Value
Purchase Details
Closed on
May 27, 1999
Sold by
Leontire George J and Milbury William J
Bought by
Langston John R
Purchase Details
Closed on
Feb 27, 1990
Sold by
Milbury William J
Bought by
Leontire George J
Create a Home Valuation Report for This Property
The Home Valuation Report is an in-depth analysis detailing your home's value as well as a comparison with similar homes in the area
Home Values in the Area
Average Home Value in this Area
Purchase History
| Date | Buyer | Sale Price | Title Company |
|---|---|---|---|
| Cassi Ward Power T | $2,850,000 | None Available | |
| Cassi Ward Power T | $2,850,000 | None Available | |
| Langston John R | $775,000 | -- | |
| Langston John R | $775,000 | -- | |
| Leontire George J | $259,000 | -- | |
| Leontire George J | $259,000 | -- |
Source: Public Records
Mortgage History
| Date | Status | Borrower | Loan Amount |
|---|---|---|---|
| Previous Owner | Leontire George J | $510,000 |
Source: Public Records
Tax History Compared to Growth
Tax History
| Year | Tax Paid | Tax Assessment Tax Assessment Total Assessment is a certain percentage of the fair market value that is determined by local assessors to be the total taxable value of land and additions on the property. | Land | Improvement |
|---|---|---|---|---|
| 2025 | $17,351 | $2,221,600 | $914,500 | $1,307,100 |
| 2024 | $17,750 | $2,213,200 | $870,900 | $1,342,300 |
| 2023 | $14,431 | $1,638,000 | $539,600 | $1,098,400 |
| 2022 | $13,873 | $1,374,900 | $477,500 | $897,400 |
| 2021 | $13,519 | $1,255,200 | $434,500 | $820,700 |
| 2020 | $13,390 | $1,246,700 | $430,400 | $816,300 |
| 2019 | $13,371 | $1,272,200 | $499,500 | $772,700 |
| 2018 | $12,789 | $1,213,400 | $475,800 | $737,600 |
| 2017 | $11,991 | $1,164,200 | $522,100 | $642,100 |
| 2016 | $11,711 | $1,152,700 | $522,100 | $630,600 |
| 2015 | $11,608 | $1,152,700 | $522,100 | $630,600 |
Source: Public Records
Map
Nearby Homes
- 22 Nairn Rd
- 48 Red Brook Harbor Rd
- 3 Red Brook Pond Dr
- 1094 County Rd
- 940 County Rd
- 171 Bellavista Dr
- 1234 Route 28a
- 1234 Route 28a
- 254 Barlows Landing Rd
- 10 Squeteague Harbor Rd
- 34 Kenwood Rd
- 75 Winsor Rd
- 45 Kenwood Rd
- 940 County Rd
- 709 County Rd
- 70 Wings Neck Rd
- 7 4th Ave
- 174 Barlows Landing Rd
- 15 1st St
- 250 Scraggy Neck Rd