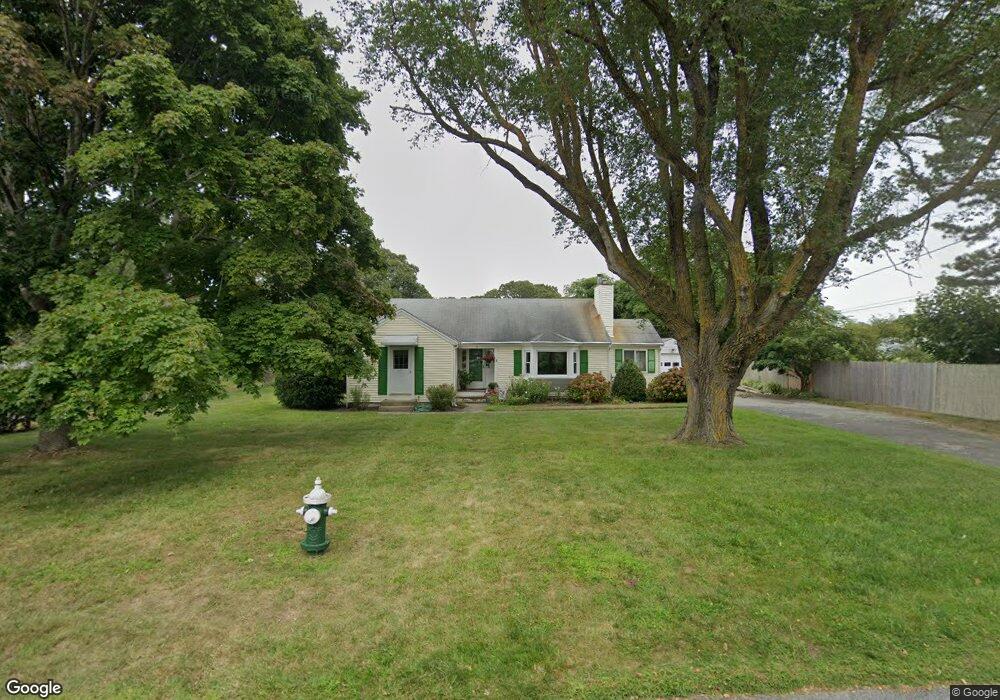
10 Nauhaught Rd South Yarmouth, MA 02664
Estimated Value: $538,000 - $615,000
3
Beds
2
Baths
1,501
Sq Ft
$391/Sq Ft
Est. Value
About This Home
This home is located at 10 Nauhaught Rd, South Yarmouth, MA 02664 and is currently estimated at $587,441, approximately $391 per square foot. 10 Nauhaught Rd is a home located in Barnstable County with nearby schools including Dennis-Yarmouth Regional High School and St. Pius X. School.
Ownership History
Date
Name
Owned For
Owner Type
Purchase Details
Closed on
Aug 25, 1998
Sold by
Ruhan James F
Bought by
Huseby Jeanne S
Current Estimated Value
Purchase Details
Closed on
May 11, 1995
Sold by
Sandwich Coop Bk
Bought by
Ruhan James F
Purchase Details
Closed on
May 31, 1994
Sold by
Bohannon Mark F and Bohannon Lorraine A
Bought by
Sandwich Coop Bk
Create a Home Valuation Report for This Property
The Home Valuation Report is an in-depth analysis detailing your home's value as well as a comparison with similar homes in the area
Home Values in the Area
Average Home Value in this Area
Purchase History
| Date | Buyer | Sale Price | Title Company |
|---|---|---|---|
| Huseby Jeanne S | $99,900 | -- | |
| Ruhan James F | $74,000 | -- | |
| Sandwich Coop Bk | $80,000 | -- |
Source: Public Records
Mortgage History
| Date | Status | Borrower | Loan Amount |
|---|---|---|---|
| Open | Sandwich Coop Bk | $127,000 | |
| Closed | Sandwich Coop Bk | $100,000 | |
| Closed | Sandwich Coop Bk | $46,600 |
Source: Public Records
Tax History Compared to Growth
Tax History
| Year | Tax Paid | Tax Assessment Tax Assessment Total Assessment is a certain percentage of the fair market value that is determined by local assessors to be the total taxable value of land and additions on the property. | Land | Improvement |
|---|---|---|---|---|
| 2025 | $3,316 | $468,300 | $184,300 | $284,000 |
| 2024 | $3,076 | $416,800 | $155,900 | $260,900 |
| 2023 | $2,966 | $365,700 | $134,900 | $230,800 |
| 2022 | $2,814 | $306,500 | $122,600 | $183,900 |
| 2021 | $2,662 | $278,500 | $122,600 | $155,900 |
| 2020 | $2,674 | $267,400 | $122,600 | $144,800 |
| 2019 | $2,489 | $246,400 | $122,600 | $123,800 |
| 2018 | $2,349 | $228,300 | $104,500 | $123,800 |
| 2017 | $2,241 | $223,700 | $99,900 | $123,800 |
| 2016 | $2,143 | $214,700 | $90,900 | $123,800 |
| 2015 | $2,128 | $212,000 | $90,900 | $121,100 |
Source: Public Records
Map
Nearby Homes