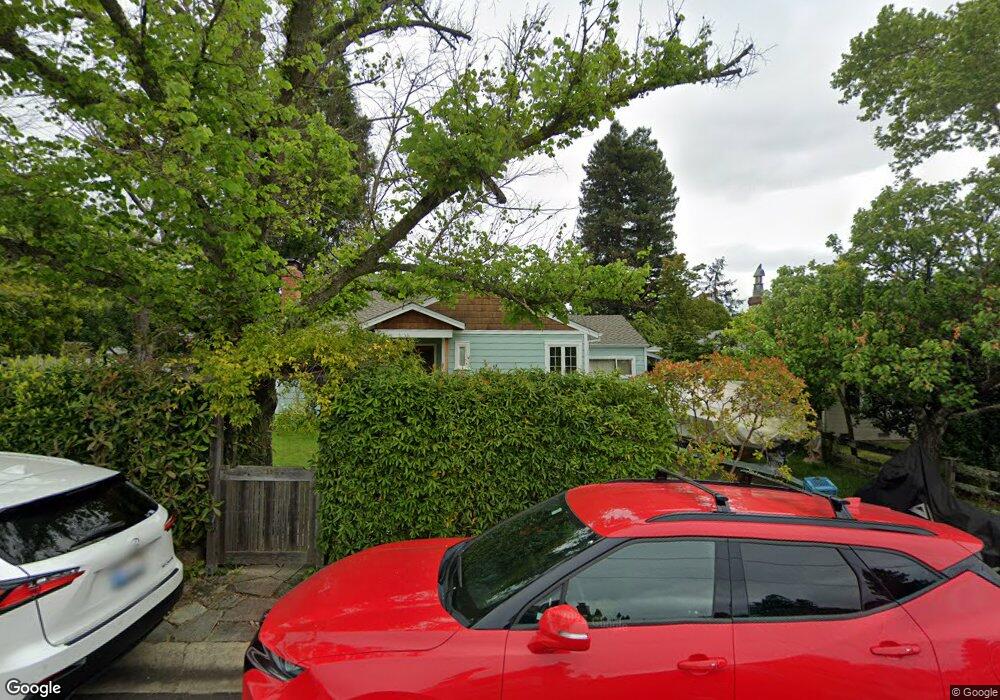
10 Nevada St San Rafael, CA 94901
Sun Valley NeighborhoodEstimated Value: $1,088,135 - $1,550,000
3
Beds
2
Baths
1,281
Sq Ft
$985/Sq Ft
Est. Value
About This Home
This home is located at 10 Nevada St, San Rafael, CA 94901 and is currently estimated at $1,261,784, approximately $984 per square foot. 10 Nevada St is a home located in Marin County with nearby schools including Sun Valley Elementary School, James B. Davidson Middle School, and San Rafael High School.
Ownership History
Date
Name
Owned For
Owner Type
Purchase Details
Closed on
Sep 29, 1994
Sold by
Provencher David Lee and Murphey Mary F
Bought by
Gawoski Douglas S and Gawoski Deirdre B
Current Estimated Value
Home Financials for this Owner
Home Financials are based on the most recent Mortgage that was taken out on this home.
Original Mortgage
$231,600
Interest Rate
3.95%
Create a Home Valuation Report for This Property
The Home Valuation Report is an in-depth analysis detailing your home's value as well as a comparison with similar homes in the area
Home Values in the Area
Average Home Value in this Area
Purchase History
| Date | Buyer | Sale Price | Title Company |
|---|---|---|---|
| Gawoski Douglas S | $289,501 | -- |
Source: Public Records
Mortgage History
| Date | Status | Borrower | Loan Amount |
|---|---|---|---|
| Closed | Gawoski Douglas S | $231,600 |
Source: Public Records
Tax History
| Year | Tax Paid | Tax Assessment Tax Assessment Total Assessment is a certain percentage of the fair market value that is determined by local assessors to be the total taxable value of land and additions on the property. | Land | Improvement |
|---|---|---|---|---|
| 2025 | $8,079 | $486,229 | $293,081 | $193,148 |
| 2024 | $7,703 | $476,696 | $287,335 | $189,361 |
| 2023 | $7,522 | $467,351 | $281,702 | $185,649 |
| 2022 | $7,149 | $458,188 | $276,179 | $182,009 |
| 2021 | $7,036 | $449,204 | $270,764 | $178,440 |
| 2020 | $6,936 | $444,599 | $267,988 | $176,611 |
| 2019 | $6,672 | $435,882 | $262,734 | $173,148 |
| 2018 | $6,601 | $427,335 | $257,582 | $169,753 |
| 2017 | $6,367 | $418,957 | $252,532 | $166,425 |
| 2016 | $6,141 | $410,745 | $247,582 | $163,163 |
| 2015 | $5,872 | $404,575 | $243,863 | $160,712 |
| 2014 | $5,614 | $396,651 | $239,087 | $157,564 |
Source: Public Records
Map
Nearby Homes
Your Personal Tour Guide
Ask me questions while you tour the home.