Estimated Value: $363,000 - $428,213
3
Beds
2
Baths
1,352
Sq Ft
$298/Sq Ft
Est. Value
About This Home
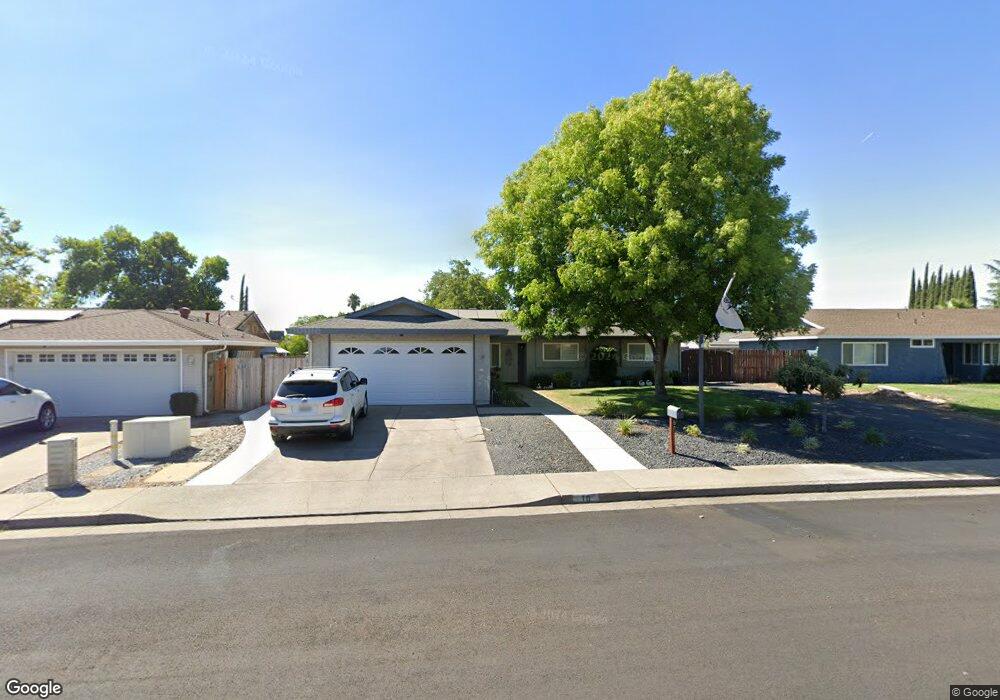
This home is located at 10 Niagara Way, Chico, CA 95928 and is currently estimated at $402,803, approximately $297 per square foot. 10 Niagara Way is a home located in Butte County with nearby schools including Little Chico Creek Elementary School, Harry M. Marsh Junior High School, and Chico High School.
Ownership History
Date
Name
Owned For
Owner Type
Purchase Details
Closed on
Dec 17, 2019
Sold by
Arevalo Leonel
Bought by
Miranda Silvia P
Current Estimated Value
Home Financials for this Owner
Home Financials are based on the most recent Mortgage that was taken out on this home.
Original Mortgage
$250,750
Outstanding Balance
$221,072
Interest Rate
3.6%
Mortgage Type
New Conventional
Estimated Equity
$181,731
Purchase Details
Closed on
Feb 6, 2017
Sold by
Cameron Grover Bruce and Cameron Susan
Bought by
Cameron Grover Bruce and Cameron Susan J
Purchase Details
Closed on
Aug 25, 1998
Sold by
Tuter Diane
Bought by
Cameron Grover Bruce and Cameron Susan C
Home Financials for this Owner
Home Financials are based on the most recent Mortgage that was taken out on this home.
Original Mortgage
$89,600
Interest Rate
6.91%
Create a Home Valuation Report for This Property
The Home Valuation Report is an in-depth analysis detailing your home's value as well as a comparison with similar homes in the area
Purchase History
We collect this data history from publicly available records. To have your information removed, we recommend requesting removal directly through your county’s website.
| Date | Buyer | Sale Price | Title Company |
|---|---|---|---|
| Miranda Silvia P | -- | Bidwell Title & Escrow Co | |
| Miranda Silvia P | $295,000 | Bidwell Title & Escrow Co | |
| Cameron Grover Bruce | -- | None Available | |
| Cameron Grover Bruce | $112,000 | Bidwell Title & Escrow Compa |
Source: Public Records
Mortgage History
We collect this data history from publicly available records. To have your information removed, we recommend requesting removal directly through your county’s website.
| Date | Status | Borrower | Loan Amount |
|---|---|---|---|
| Open | Miranda Silvia P | $250,750 | |
| Previous Owner | Cameron Grover Bruce | $89,600 |
Source: Public Records
Tax History
| Year | Tax Paid | Tax Assessment Tax Assessment Total Assessment is a certain percentage of the fair market value that is determined by local assessors to be the total taxable value of land and additions on the property. | Land | Improvement |
|---|---|---|---|---|
| 2025 | $3,595 | $329,073 | $156,171 | $172,902 |
| 2024 | $3,595 | $322,621 | $153,109 | $169,512 |
| 2023 | $3,553 | $316,296 | $150,107 | $166,189 |
| 2022 | $3,499 | $310,095 | $147,164 | $162,931 |
| 2021 | $3,429 | $304,016 | $144,279 | $159,737 |
| 2020 | $3,423 | $300,900 | $142,800 | $158,100 |
| 2019 | $1,812 | $157,382 | $59,015 | $98,367 |
| 2018 | $1,778 | $154,297 | $57,858 | $96,439 |
| 2017 | $1,738 | $151,273 | $56,724 | $94,549 |
| 2016 | $1,590 | $148,308 | $55,612 | $92,696 |
| 2015 | $1,588 | $146,081 | $54,777 | $91,304 |
| 2014 | $1,555 | $143,220 | $53,704 | $89,516 |
Source: Public Records
Map
Nearby Homes
- 9 Niagara Way
- 18 Jasper Dr
- 17 Tioga Way
- 2251 Notre Dame Blvd
- 2375 Notre Dame Blvd Unit 9
- 2375 Notre Dame Blvd Unit 1
- 2154 Talbert Dr
- 2227 Hutchinson St
- 12 Wrangler Ct
- 1810 Roth St
- 0 Talbert Dr Unit SN26066471
- 123 Raley Blvd
- 1813 Devonshire Dr
- 2061 Rochester Dr
- 2050 Springfield Dr Unit 103
- 2050 Springfield Dr
- 2050 Springfield Dr Unit 138
- 2050 Springfield Dr Unit 212
- 2050 Springfield Dr Unit 323
- 2766 Garden Valley Terrace
Your Personal Tour Guide
Ask me questions while you tour the home.