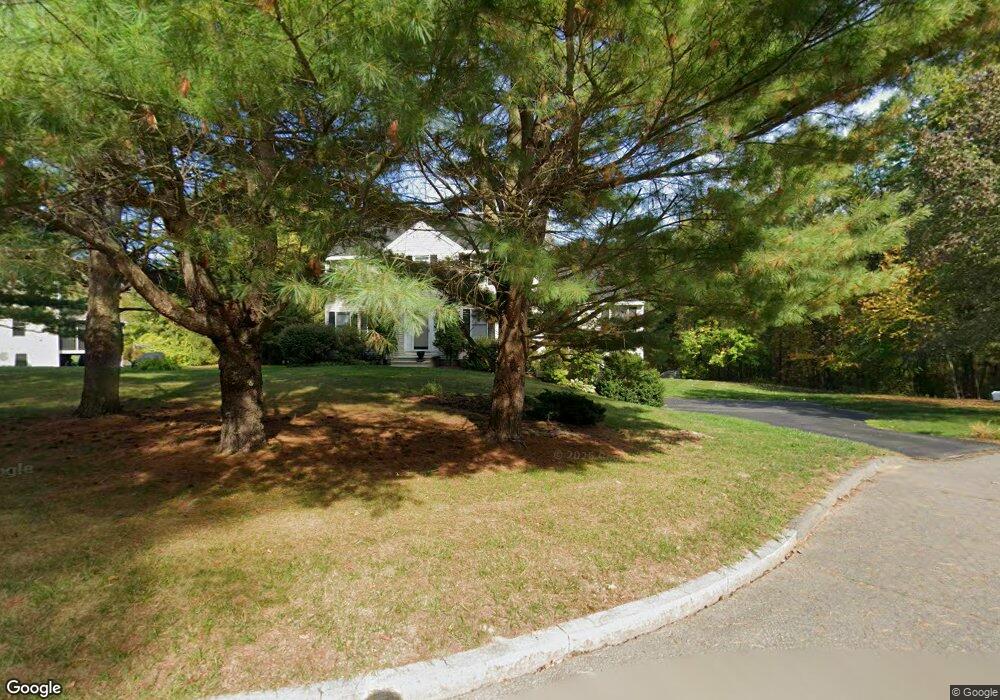
10 Nixon Rd Hudson, MA 01749
Estimated Value: $774,535 - $864,000
4
Beds
3
Baths
2,232
Sq Ft
$368/Sq Ft
Est. Value
About This Home
This home is located at 10 Nixon Rd, Hudson, MA 01749 and is currently estimated at $821,634, approximately $368 per square foot. 10 Nixon Rd is a home located in Middlesex County with nearby schools including David J. Quinn Middle School, Hudson High School, and First Steps Children's Center.
Ownership History
Date
Name
Owned For
Owner Type
Purchase Details
Closed on
Jun 23, 1998
Sold by
Zamir Inc
Bought by
Waingortin Ernest B and Waingortin Lee S
Current Estimated Value
Home Financials for this Owner
Home Financials are based on the most recent Mortgage that was taken out on this home.
Original Mortgage
$205,000
Interest Rate
7.09%
Mortgage Type
Purchase Money Mortgage
Create a Home Valuation Report for This Property
The Home Valuation Report is an in-depth analysis detailing your home's value as well as a comparison with similar homes in the area
Home Values in the Area
Average Home Value in this Area
Purchase History
| Date | Buyer | Sale Price | Title Company |
|---|---|---|---|
| Waingortin Ernest B | $245,810 | -- |
Source: Public Records
Mortgage History
| Date | Status | Borrower | Loan Amount |
|---|---|---|---|
| Open | Waingortin Ernest B | $245,000 | |
| Closed | Waingortin Ernest B | $203,700 | |
| Closed | Waingortin Ernest B | $205,000 |
Source: Public Records
Tax History Compared to Growth
Tax History
| Year | Tax Paid | Tax Assessment Tax Assessment Total Assessment is a certain percentage of the fair market value that is determined by local assessors to be the total taxable value of land and additions on the property. | Land | Improvement |
|---|---|---|---|---|
| 2025 | $9,973 | $718,500 | $260,600 | $457,900 |
| 2024 | $9,712 | $693,700 | $237,200 | $456,500 |
| 2023 | $8,815 | $603,800 | $228,300 | $375,500 |
| 2022 | $8,485 | $535,000 | $207,700 | $327,300 |
| 2021 | $8,098 | $488,100 | $197,700 | $290,400 |
| 2020 | $8,043 | $484,200 | $193,800 | $290,400 |
| 2019 | $7,767 | $449,600 | $193,800 | $255,800 |
| 2018 | $7,725 | $441,400 | $184,300 | $257,100 |
| 2017 | $7,355 | $420,300 | $175,400 | $244,900 |
| 2016 | $6,887 | $398,300 | $175,400 | $222,900 |
| 2015 | $6,443 | $373,100 | $161,500 | $211,600 |
| 2014 | $6,154 | $353,300 | $141,900 | $211,400 |
Source: Public Records
Map
Nearby Homes
- 223 Central St
- 25 Old Stone Cir
- 3 Highland Park Ave
- 133 Lincoln St
- 0 Mill Pond Rd Unit 73442819
- 104 Lincoln St
- 55 Cottage St
- 315 Central St
- 1 Barracks Rd Unit 1
- 30 Maple St
- 37 Teresa Rd
- 322 Central St
- 4 Linden St
- 6 Century Mill Rd
- 1 Century Mill Rd
- 21 Gates Ave
- 200 Manning St Unit 6C
- 200 Manning St Unit 14B
- 74 Cox St Unit 9
- 18-24 River St Unit 1