
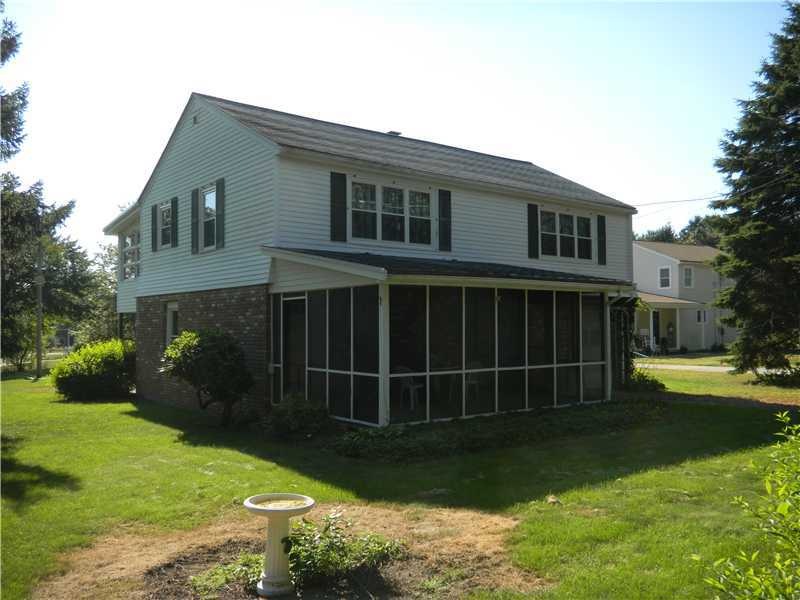
10 Old Elm St Bellingham, MA 02019
2
Beds
2
Baths
1,660
Sq Ft
0.54
Acres
Highlights
- Water Views
- Wooded Lot
- Corner Lot
- Deck
- Wood Flooring
- Thermal Windows
About This Home
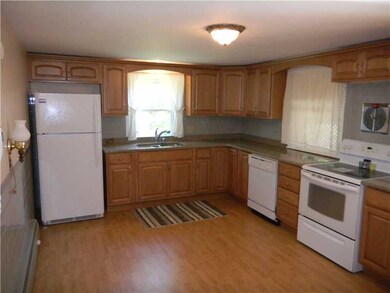
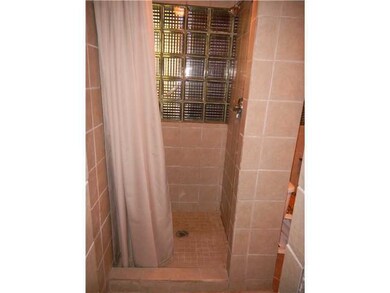
As of December 2020Unique one owner home on a private lot with pond view. Quiet street near highways/shopping. 2 beds, 2 tiled baths plus new eat-in kitchen with maple cabinets/granite. Opens to 9x25 sunroom and another 12x12 screen room. Garages and walkout. Relax!
Last Agent to Sell the Property
Sandra Soares
Residential Properties Ltd. License #RES.0028055
Last Buyer's Agent
Non-Mls Member
Non-Mls Member
Home Details
Home Type
- Single Family
Est. Annual Taxes
- $3,000
Year Built
- Built in 1955
Lot Details
- 0.54 Acre Lot
- Corner Lot
- Wooded Lot
Parking
- 2 Car Attached Garage
Home Design
- Split Level Home
- Brick Exterior Construction
- Vinyl Siding
- Concrete Perimeter Foundation
Interior Spaces
- 2-Story Property
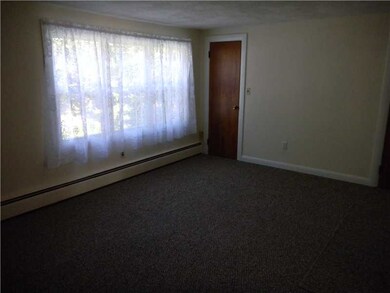
- Thermal Windows
- Water Views
- Storm Windows
Kitchen
- Oven
- Range
- Dishwasher
- Disposal
Flooring
- Wood
- Carpet
- Laminate
Bedrooms and Bathrooms
- 2 Bedrooms
- 2 Full Bathrooms
Laundry
- Dryer
- Washer
Partially Finished Basement
- Walk-Out Basement
- Basement Fills Entire Space Under The House
Outdoor Features
- Deck
- Patio
Location
- Property near a hospital
Utilities
- No Cooling
- Heating System Uses Oil
- Baseboard Heating
- Heating System Uses Steam
- 100 Amp Service
- Tankless Water Heater
- Oil Water Heater
- Septic Tank
Listing and Financial Details
- Tax Lot 6
- Assessor Parcel Number 10OLDELMSTBELL
Community Details
Overview
- Rt. 126 Subdivision
Amenities
- Shops
- Public Transportation
Map
Create a Home Valuation Report for This Property
The Home Valuation Report is an in-depth analysis detailing your home's value as well as a comparison with similar homes in the area
Similar Home in Bellingham, MA
Home Values in the Area
Average Home Value in this Area
Mortgage History
| Date | Status | Loan Amount | Loan Type |
|---|---|---|---|
| Closed | $345,320 | New Conventional | |
| Closed | $18,000 | Unknown | |
| Closed | $234,693 | New Conventional | |
| Closed | $176,000 | New Conventional |
Source: Public Records
Property History
| Date | Event | Price | Change | Sq Ft Price |
|---|---|---|---|---|
| 12/23/2020 12/23/20 | Sold | $356,000 | -1.1% | $250 / Sq Ft |
| 11/10/2020 11/10/20 | Pending | -- | -- | -- |
| 10/14/2020 10/14/20 | For Sale | $359,900 | +56.5% | $253 / Sq Ft |
| 05/19/2015 05/19/15 | Sold | $230,000 | -4.1% | $162 / Sq Ft |
| 04/08/2015 04/08/15 | Pending | -- | -- | -- |
| 04/01/2015 04/01/15 | For Sale | $239,900 | +9.0% | $169 / Sq Ft |
| 04/03/2013 04/03/13 | Sold | $220,000 | -8.1% | $133 / Sq Ft |
| 03/04/2013 03/04/13 | Pending | -- | -- | -- |
| 09/14/2012 09/14/12 | For Sale | $239,500 | -- | $144 / Sq Ft |
Source: State-Wide MLS
Tax History
| Year | Tax Paid | Tax Assessment Tax Assessment Total Assessment is a certain percentage of the fair market value that is determined by local assessors to be the total taxable value of land and additions on the property. | Land | Improvement |
|---|---|---|---|---|
| 2025 | $4,937 | $393,100 | $132,600 | $260,500 |
| 2024 | $4,727 | $367,600 | $121,100 | $246,500 |
| 2023 | $4,554 | $349,000 | $115,300 | $233,700 |
| 2022 | $4,477 | $318,000 | $96,200 | $221,800 |
| 2021 | $4,115 | $285,600 | $96,200 | $189,400 |
| 2020 | $3,902 | $274,400 | $96,200 | $178,200 |
| 2019 | $3,814 | $268,400 | $96,200 | $172,200 |
| 2018 | $3,564 | $247,300 | $97,000 | $150,300 |
| 2017 | $3,470 | $242,000 | $97,000 | $145,000 |
| 2016 | $3,361 | $235,200 | $100,900 | $134,300 |
| 2015 | -- | $226,100 | $97,000 | $129,100 |
| 2014 | $3,211 | $219,000 | $93,600 | $125,400 |
Source: Public Records
Source: State-Wide MLS
MLS Number: 1025711
APN: BELL-000086-000006
Disclaimer: Certain information contained herein is derived from information provided by parties other than Homes.com. All information provided is deemed reliable, but is not guaranteed to be accurate and should be independently verified.
![]() IDX information is provided exclusively for personal, non-commercial use, and may not be used for any purpose other than to identify prospective properties consumers may be interested in purchasing. Information is deemed reliable but not guaranteed.
IDX information is provided exclusively for personal, non-commercial use, and may not be used for any purpose other than to identify prospective properties consumers may be interested in purchasing. Information is deemed reliable but not guaranteed.
Copyright © 2025 State-Wide MLS, Inc. All rights reserved.
Nearby Homes