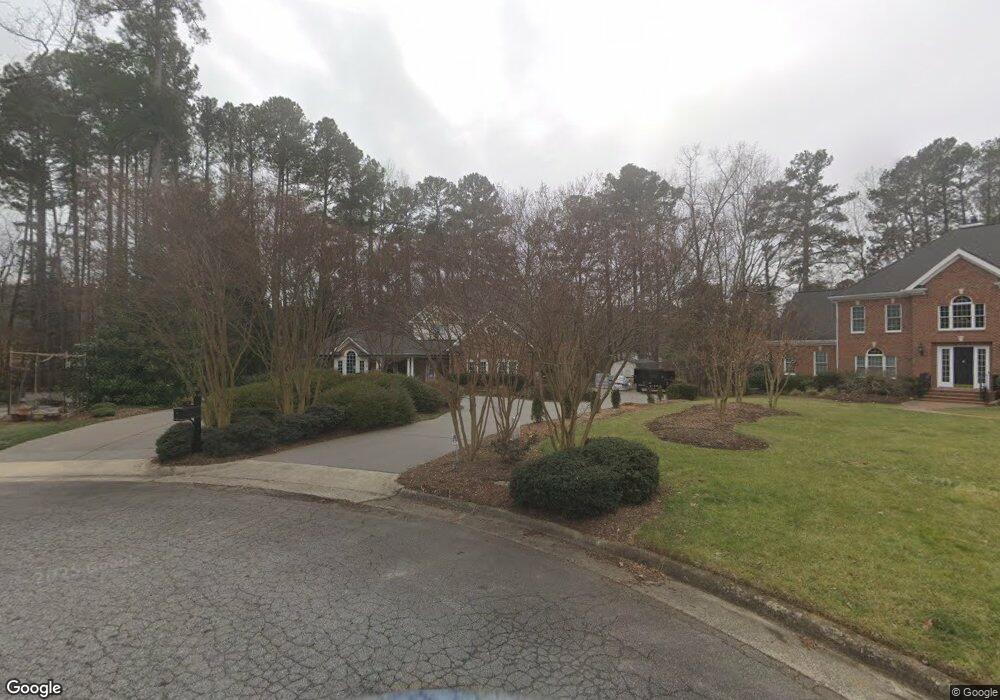
10 Old Hope Creek Path Durham, NC 27707
Hope Valley NeighborhoodEstimated Value: $928,000 - $1,186,942
3
Beds
4
Baths
3,550
Sq Ft
$309/Sq Ft
Est. Value
About This Home
This home is located at 10 Old Hope Creek Path, Durham, NC 27707 and is currently estimated at $1,096,314, approximately $308 per square foot. 10 Old Hope Creek Path is a home located in Durham County with nearby schools including Morehead Montessori, Sherwood Githens Middle, and Jordan High School.
Ownership History
Date
Name
Owned For
Owner Type
Purchase Details
Closed on
Jun 24, 2014
Sold by
Gilliss Thomas P and Gilliss Catherine L
Bought by
Smith Thomas T and Smith Valerie G
Current Estimated Value
Home Financials for this Owner
Home Financials are based on the most recent Mortgage that was taken out on this home.
Original Mortgage
$548,000
Interest Rate
4.23%
Mortgage Type
New Conventional
Purchase Details
Closed on
Oct 11, 2008
Sold by
Whalen Robert E and Whalen Evelyn Y
Bought by
Gilliss Thomas P and Gilliss Catherine L
Home Financials for this Owner
Home Financials are based on the most recent Mortgage that was taken out on this home.
Original Mortgage
$417,000
Interest Rate
5.78%
Mortgage Type
Purchase Money Mortgage
Create a Home Valuation Report for This Property
The Home Valuation Report is an in-depth analysis detailing your home's value as well as a comparison with similar homes in the area
Home Values in the Area
Average Home Value in this Area
Purchase History
| Date | Buyer | Sale Price | Title Company |
|---|---|---|---|
| Smith Thomas T | $685,000 | None Available | |
| Gilliss Thomas P | $570,000 | None Available |
Source: Public Records
Mortgage History
| Date | Status | Borrower | Loan Amount |
|---|---|---|---|
| Closed | Smith Thomas T | $548,000 | |
| Previous Owner | Gilliss Thomas P | $417,000 |
Source: Public Records
Tax History
| Year | Tax Paid | Tax Assessment Tax Assessment Total Assessment is a certain percentage of the fair market value that is determined by local assessors to be the total taxable value of land and additions on the property. | Land | Improvement |
|---|---|---|---|---|
| 2025 | $10,826 | $1,092,127 | $290,625 | $801,502 |
| 2024 | $8,810 | $631,575 | $155,300 | $476,275 |
| 2023 | $8,273 | $631,575 | $155,300 | $476,275 |
| 2022 | $8,084 | $631,575 | $155,300 | $476,275 |
| 2021 | $8,046 | $631,575 | $155,300 | $476,275 |
| 2020 | $7,856 | $631,575 | $155,300 | $476,275 |
| 2019 | $7,856 | $631,575 | $155,300 | $476,275 |
| 2018 | $8,330 | $614,099 | $93,300 | $520,799 |
| 2017 | $8,269 | $614,099 | $93,300 | $520,799 |
| 2016 | $7,990 | $614,099 | $93,300 | $520,799 |
| 2015 | $5,711 | $412,534 | $76,467 | $336,067 |
| 2014 | $5,711 | $412,534 | $76,467 | $336,067 |
Source: Public Records
Map
Nearby Homes
- 3934 Old Chapel Hill Rd
- 3932 Old Chapel Hill Rd
- 3914 Old Chapel Hill Rd
- 20 Chancery Place
- 38 Innisfree Dr
- 18 Scottish Ln
- 3841 Somerset Dr
- 103 Ashworth Dr
- 3903 Kelly Dr
- 3613 A Suffolk St
- 3613 B Suffolk St
- 16 Stillwater Park Unit 16
- 10 Melstone Turn
- 3624 Shrewsbury St
- 3503 Old Chapel Hill Rd
- 3906 Sterling Ridge Ln
- 3930 Kelly Dr
- 3946 Nottaway Rd
- 4014 Nottaway Rd
- 3436 Rugby Rd
- 10 Old Hope Creek Path
- 8 Old Hope Creek Path
- 11 Old Hope Creek Path
- 11 Old Hope Creek Path
- 8 Thackeray Place
- 8 Thackery Place
- 4 Old Hope Creek Path
- 9 Old Hope Creek Path
- 7 Thackery Place
- 6 Thackery Place
- 7 Thackeray Place
- 6 Thackeray Place
- 7 Old Hope Creek Path
- 2 Old Hope Creek Path
- 5 Old Hope Creek Path
- 5 Old Hope Creek Path
- 3702 Saint Marks Rd
- 3706 Saint Marks Rd
- 3602 St Marks Rd
- 3605 Westover Rd
Your Personal Tour Guide
Ask me questions while you tour the home.