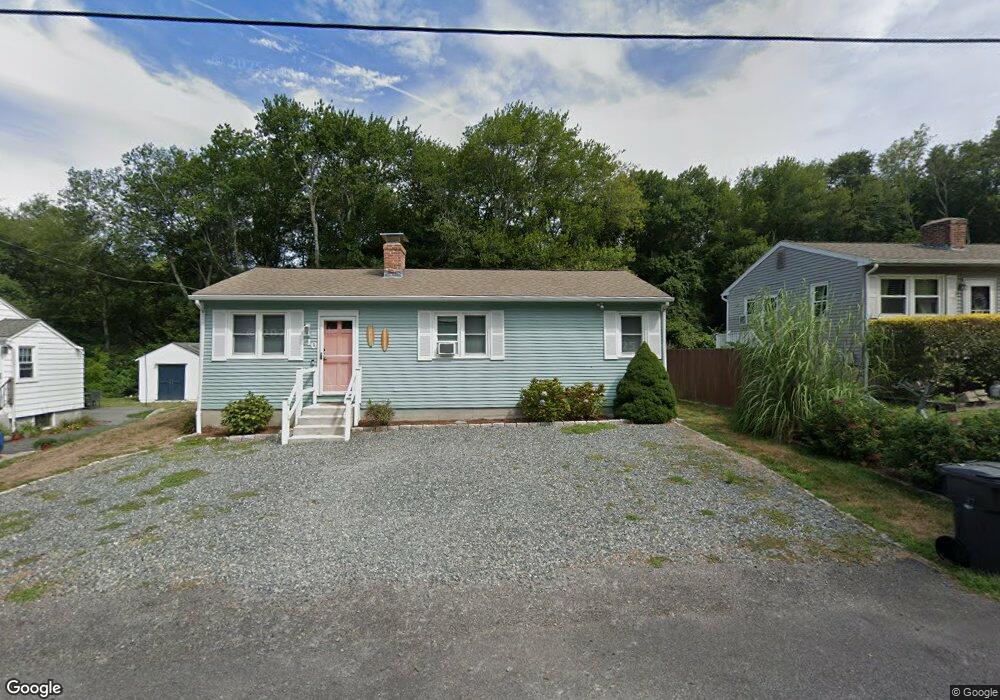
10 Onondega Rd Narragansett, RI 02882
Estimated Value: $765,861 - $937,000
3
Beds
1
Bath
960
Sq Ft
$859/Sq Ft
Est. Value
About This Home
This home is located at 10 Onondega Rd, Narragansett, RI 02882 and is currently estimated at $824,965, approximately $859 per square foot. 10 Onondega Rd is a home located in Washington County with nearby schools including Narragansett Elementary School, Narragansett Pier Middle School, and Narragansett High School.
Ownership History
Date
Name
Owned For
Owner Type
Purchase Details
Closed on
Dec 9, 2021
Sold by
Houston Shannon M and Bugna Brad A
Bought by
Bugnalow Llc
Current Estimated Value
Purchase Details
Closed on
Jun 12, 2020
Sold by
Squeo Nicholas S
Bought by
Houston Shannon M and Bugna Brad A
Purchase Details
Closed on
Jan 10, 2008
Sold by
Delgizzo Fred and Webster-Delgizzo Marie
Bought by
Squeo Nicholas S and Squeo Kristine M
Home Financials for this Owner
Home Financials are based on the most recent Mortgage that was taken out on this home.
Original Mortgage
$288,000
Interest Rate
6.21%
Mortgage Type
Purchase Money Mortgage
Purchase Details
Closed on
May 8, 2002
Sold by
Cummings Kevin J and Cummings Mary R
Bought by
Delgizzo Fred and Delgizzo Marie W
Create a Home Valuation Report for This Property
The Home Valuation Report is an in-depth analysis detailing your home's value as well as a comparison with similar homes in the area
Home Values in the Area
Average Home Value in this Area
Purchase History
| Date | Buyer | Sale Price | Title Company |
|---|---|---|---|
| Bugnalow Llc | -- | None Available | |
| Houston Shannon M | $430,000 | None Available | |
| Houston Shannon M | $430,000 | None Available | |
| Squeo Nicholas S | $360,000 | -- | |
| Delgizzo Fred | $222,942 | -- |
Source: Public Records
Mortgage History
| Date | Status | Borrower | Loan Amount |
|---|---|---|---|
| Previous Owner | Delgizzo Fred | $225,000 | |
| Previous Owner | Delgizzo Fred | $284,000 | |
| Previous Owner | Delgizzo Fred | $288,000 |
Source: Public Records
Tax History Compared to Growth
Tax History
| Year | Tax Paid | Tax Assessment Tax Assessment Total Assessment is a certain percentage of the fair market value that is determined by local assessors to be the total taxable value of land and additions on the property. | Land | Improvement |
|---|---|---|---|---|
| 2025 | $4,677 | $688,800 | $425,000 | $263,800 |
| 2024 | $4,512 | $688,800 | $425,000 | $263,800 |
| 2023 | $4,018 | $431,600 | $250,000 | $181,600 |
| 2022 | $3,884 | $431,600 | $250,000 | $181,600 |
| 2021 | $3,824 | $431,600 | $250,000 | $181,600 |
| 2020 | $3,833 | $365,700 | $188,200 | $177,500 |
| 2019 | $3,741 | $365,700 | $188,200 | $177,500 |
| 2018 | $3,639 | $365,700 | $188,200 | $177,500 |
| 2017 | $3,256 | $308,300 | $192,500 | $115,800 |
| 2016 | $3,108 | $308,300 | $192,500 | $115,800 |
| 2015 | $3,065 | $308,300 | $192,500 | $115,800 |
| 2014 | $3,125 | $311,300 | $192,500 | $118,800 |
Source: Public Records
Map
Nearby Homes
- 137 Bonnet Shores Rd
- 18 Anawan Ave
- 55 Bonnet Shores Rd
- 20 Anchorage Rd
- 53 Bonnet Shores Rd
- 51 Bonnet Shores Rd
- 91 Bonnet Point Rd
- 51 Osceola Ave
- 0 Betty Dr
- 64 Juniper Trail
- 74 Bayberry Rd
- 12 Overlook Rd
- 18 Lakeview Dr
- 7 Leatherleaf Rd
- 264 Colonel John Gardner Rd
- 80 Old Pine Rd
- 121 Spice Bush Trail
- 49 Meadow Sweet Trail
- 47 Wake Robin Trail
- 416 Bridgetown Rd
- 10 Onondega Rd
- 8 Onondega Rd
- 12 Onondega Rd
- 16 Onondega Rd
- 7 Onondega Rd
- 13 Onondega Rd
- 4 Onondega Rd
- 5 Spring Brook Rd
- 17 Onondega Rd
- 20 Onondega Rd
- 10 What Cheer Rd
- 14 What Cheer Rd
- 20 What Cheer Rd
- 7 Spring Brook Rd
- 23 Onondega Rd
- 23 Onandega Rd
- 26 Onondega Rd
- 13 What Cheer Rd
- 9 What Cheer Rd
- 24 What Cheer Rd