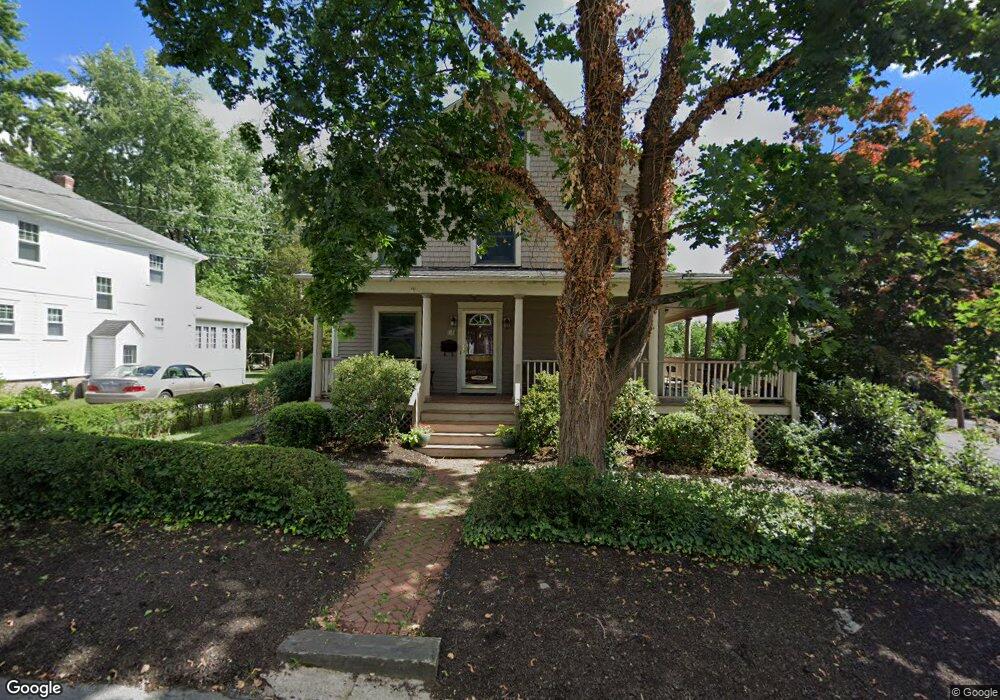
10 Overhill Rd Natick, MA 01760
Estimated Value: $917,110 - $1,186,000
3
Beds
4
Baths
2,016
Sq Ft
$521/Sq Ft
Est. Value
About This Home
This home is located at 10 Overhill Rd, Natick, MA 01760 and is currently estimated at $1,049,528, approximately $520 per square foot. 10 Overhill Rd is a home located in Middlesex County with nearby schools including Natick High School, Wilson Middle School, and Bennett-Hemenway (Ben-Hem) Elementary School.
Ownership History
Date
Name
Owned For
Owner Type
Purchase Details
Closed on
Jun 17, 2010
Sold by
Emmanouilidis Efthimios and Emmanouilidis Susan H
Bought by
Dekruyff Ann M and Jones Christopher
Current Estimated Value
Home Financials for this Owner
Home Financials are based on the most recent Mortgage that was taken out on this home.
Original Mortgage
$397,600
Outstanding Balance
$267,256
Interest Rate
5.03%
Mortgage Type
Purchase Money Mortgage
Estimated Equity
$782,272
Create a Home Valuation Report for This Property
The Home Valuation Report is an in-depth analysis detailing your home's value as well as a comparison with similar homes in the area
Home Values in the Area
Average Home Value in this Area
Purchase History
| Date | Buyer | Sale Price | Title Company |
|---|---|---|---|
| Dekruyff Ann M | $497,000 | -- |
Source: Public Records
Mortgage History
| Date | Status | Borrower | Loan Amount |
|---|---|---|---|
| Open | Dekruyff Ann M | $397,600 |
Source: Public Records
Tax History
| Year | Tax Paid | Tax Assessment Tax Assessment Total Assessment is a certain percentage of the fair market value that is determined by local assessors to be the total taxable value of land and additions on the property. | Land | Improvement |
|---|---|---|---|---|
| 2025 | $9,458 | $790,800 | $451,900 | $338,900 |
| 2024 | $9,118 | $743,700 | $426,800 | $316,900 |
| 2023 | $8,931 | $706,600 | $401,500 | $305,100 |
| 2022 | $8,607 | $645,200 | $366,200 | $279,000 |
| 2021 | $9,235 | $607,700 | $346,100 | $261,600 |
| 2020 | $5,001 | $592,700 | $331,100 | $261,600 |
| 2019 | $7,533 | $592,700 | $331,100 | $261,600 |
| 2018 | $7,570 | $588,300 | $301,000 | $287,300 |
| 2017 | $7,397 | $548,300 | $266,200 | $282,100 |
| 2016 | $7,200 | $530,600 | $251,200 | $279,400 |
| 2015 | $7,011 | $507,300 | $251,200 | $256,100 |
Source: Public Records
Map
Nearby Homes
- 7 Jackson Ct Unit B
- 27 2nd St
- 36 Winnemay St
- 293 Bacon St Unit A
- 9 Bellevue Rd
- 20 Florence St Unit B
- 16 Harvard St
- 17 Florence St
- 49 Summer St
- 45 Summer St
- 89 W Central St
- 7 High St
- 63 Pond St
- 50 Wethersfield Rd
- 3 Vale St Unit A
- 53 Harvard Street Extension
- 3 Wilson St Unit 3B
- 12 Bay State Rd
- 5 Reynolds Ave Unit 2
- 4B Lincoln St Unit 4B
Your Personal Tour Guide
Ask me questions while you tour the home.