10 Owlswood Rd Belvedere Tiburon, CA 94920
Estimated Value: $4,076,000 - $5,620,000
4
Beds
4
Baths
4,794
Sq Ft
$1,006/Sq Ft
Est. Value
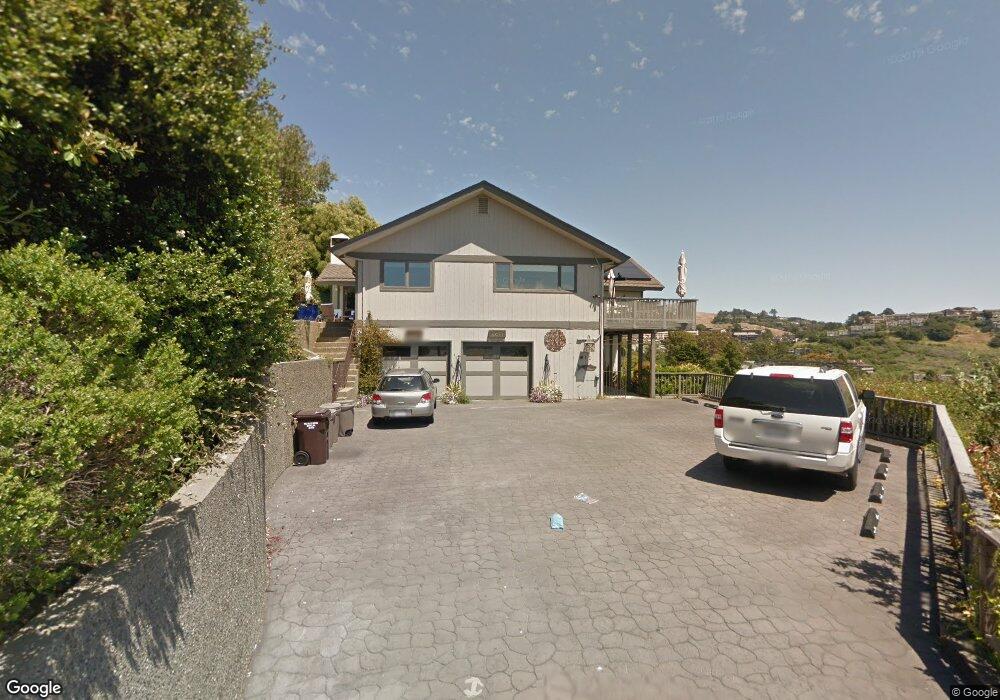
About This Home
This home is located at 10 Owlswood Rd, Belvedere Tiburon, CA 94920 and is currently estimated at $4,824,664, approximately $1,006 per square foot. 10 Owlswood Rd is a home located in Marin County with nearby schools including Reed Elementary School, Bel Aire Elementary School, and Del Mar Middle School.
Ownership History
Date
Name
Owned For
Owner Type
Purchase Details
Closed on
Jul 9, 2019
Sold by
Sankin Alan R and Barnes Tevela R
Bought by
Sankin Alan R and Barnes Teveia R
Current Estimated Value
Home Financials for this Owner
Home Financials are based on the most recent Mortgage that was taken out on this home.
Original Mortgage
$611,900
Outstanding Balance
$402,565
Interest Rate
3.9%
Mortgage Type
New Conventional
Estimated Equity
$4,422,099
Purchase Details
Closed on
May 7, 1999
Sold by
Sankin Alan R and Sankin Barnes R
Bought by
Sankin Alan R and Barnes Teveia R
Purchase Details
Closed on
Apr 29, 1994
Sold by
Thomas Violeta
Bought by
Sankin Alan R and Barnes Teveia R
Home Financials for this Owner
Home Financials are based on the most recent Mortgage that was taken out on this home.
Original Mortgage
$1,000,000
Interest Rate
4.95%
Create a Home Valuation Report for This Property
The Home Valuation Report is an in-depth analysis detailing your home's value as well as a comparison with similar homes in the area
Home Values in the Area
Average Home Value in this Area
Purchase History
| Date | Buyer | Sale Price | Title Company |
|---|---|---|---|
| Sankin Alan R | -- | None Available | |
| Sankin Alan R | -- | -- | |
| Sankin Alan R | $1,285,000 | -- |
Source: Public Records
Mortgage History
| Date | Status | Borrower | Loan Amount |
|---|---|---|---|
| Open | Sankin Alan R | $611,900 | |
| Closed | Sankin Alan R | $1,000,000 |
Source: Public Records
Tax History Compared to Growth
Tax History
| Year | Tax Paid | Tax Assessment Tax Assessment Total Assessment is a certain percentage of the fair market value that is determined by local assessors to be the total taxable value of land and additions on the property. | Land | Improvement |
|---|---|---|---|---|
| 2025 | $25,171 | $2,183,921 | $1,079,214 | $1,104,707 |
| 2024 | $25,171 | $2,141,105 | $1,058,056 | $1,083,049 |
| 2023 | $24,514 | $2,099,124 | $1,037,310 | $1,061,814 |
| 2022 | $23,916 | $2,057,965 | $1,016,971 | $1,040,994 |
| 2021 | $23,510 | $2,017,616 | $997,032 | $1,020,584 |
| 2020 | $23,937 | $1,996,941 | $986,815 | $1,010,126 |
| 2019 | $24,013 | $1,957,786 | $967,466 | $990,320 |
| 2018 | $23,515 | $1,919,404 | $948,499 | $970,905 |
| 2017 | $23,173 | $1,881,779 | $929,906 | $951,873 |
| 2016 | $22,237 | $1,844,886 | $911,675 | $933,211 |
| 2015 | $22,295 | $1,817,182 | $897,985 | $919,197 |
| 2014 | $21,587 | $1,781,587 | $880,395 | $901,192 |
Source: Public Records
Map
Nearby Homes
- 1 Tara View Rd
- 12 Tara View Rd
- 1 Trestle Glen Cir
- 0 Vistazo St E Unit 324070947
- 80 Marinero Cir
- 6 Red Hill Cir Unit 3
- 107 Mount Tiburon Rd
- 9 Edgewater Rd
- 83 Mount Tiburon Rd
- 22 Marinero Cir
- 72 Lagoon Rd
- 28 Marinero Cir Unit 34
- 121 Red Hill Cir
- 45 Corinthian Ct Unit 32
- 15 Harbor Oak Dr Unit 12
- 45 Harbor Oak Dr Unit 14
- 185 Gilmartin Dr
- 1206 Mariner Way
- 1 N Point Cir
- 24 Venado Dr
- 989 Tiburon Blvd
- 9 Owlswood Rd
- 987 Tiburon Blvd
- 65 Rolling Hills Rd
- 95 Spring Ln
- 55 Rolling Hills Rd
- 7 Owlswood Rd
- 4 Owlswood Rd
- 85 Spring Ln
- 985 Tiburon Blvd
- 75 Rolling Hills Rd
- 10 Egret Ct
- 5 Egret Ct
- 5 Owlswood Rd
- 45 Rolling Hills Rd
- 75 Spring Ln
- 943 Owlswood Ln
- 8 Egret Ct
- 953 Owlswood Ln
- 3 Owlswood Rd