Estimated Value: $251,000 - $352,000
2
Beds
1
Bath
1,116
Sq Ft
$278/Sq Ft
Est. Value
About This Home
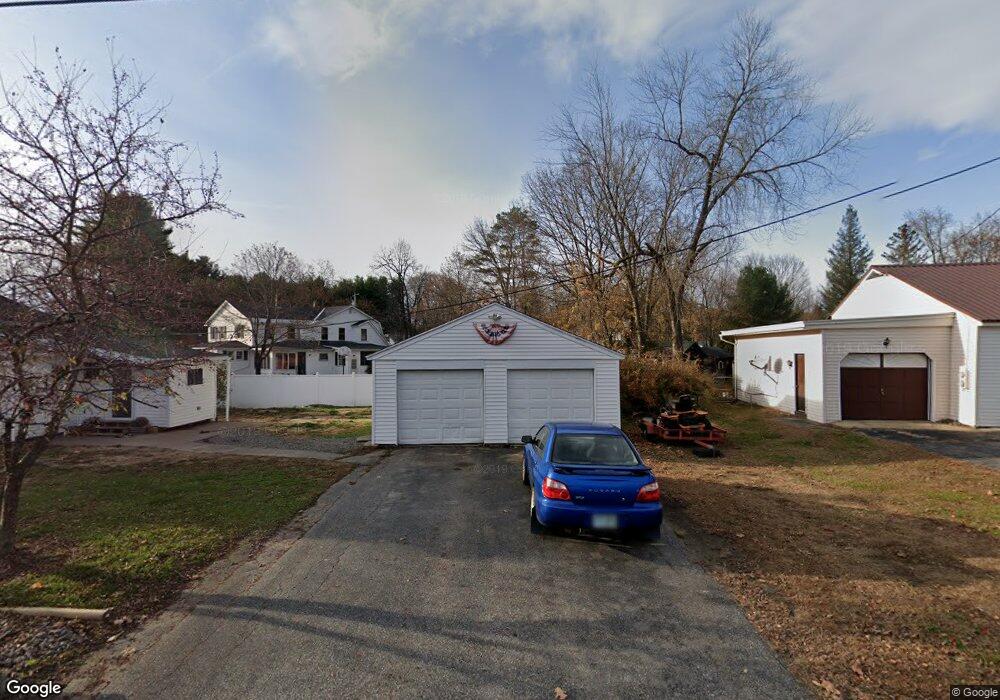
This home is located at 10 Park St, Keene, NH 03431 and is currently estimated at $310,789, approximately $278 per square foot. 10 Park St is a home located in Cheshire County with nearby schools including Mt. Caesar Elementary School, Cutler School, and Monadnock Regional High School.
Ownership History
Date
Name
Owned For
Owner Type
Purchase Details
Closed on
Sep 26, 2016
Sold by
Sandra J Brauer
Bought by
Felker Myles
Current Estimated Value
Home Financials for this Owner
Home Financials are based on the most recent Mortgage that was taken out on this home.
Original Mortgage
$87,200
Outstanding Balance
$69,951
Interest Rate
3.48%
Estimated Equity
$240,838
Purchase Details
Closed on
Jun 26, 2014
Sold by
Traymand Robbu W
Bought by
Raymond Laura V
Purchase Details
Closed on
Mar 23, 2009
Sold by
Fnma
Bought by
Brauer Sandra J
Purchase Details
Closed on
Mar 25, 2008
Sold by
Gibbs Michael E and Wells Fargo Bank Na
Bought by
Federal National Mortgage Association
Purchase Details
Closed on
Jun 30, 2006
Sold by
Bell Penny D
Bought by
Raymond Laura J and Raymond Robby W
Purchase Details
Closed on
Jun 11, 1997
Sold by
Lamoureux Pauline E
Bought by
Rendenna Gary J and Renden Emma E Donna M
Create a Home Valuation Report for This Property
The Home Valuation Report is an in-depth analysis detailing your home's value as well as a comparison with similar homes in the area
Home Values in the Area
Average Home Value in this Area
Purchase History
| Date | Buyer | Sale Price | Title Company |
|---|---|---|---|
| Felker Myles | -- | -- | |
| Raymond Laura V | -- | -- | |
| Brauer Sandra J | $25,000 | -- | |
| Federal National Mortgage Association | $135,400 | -- | |
| Raymond Laura J | $147,000 | -- | |
| Rendenna Gary J | $69,900 | -- |
Source: Public Records
Mortgage History
| Date | Status | Borrower | Loan Amount |
|---|---|---|---|
| Open | Rendenna Gary J | $87,200 | |
| Closed | Rendenna Gary J | -- | |
| Previous Owner | Rendenna Gary J | $151,242 |
Source: Public Records
Tax History Compared to Growth
Tax History
| Year | Tax Paid | Tax Assessment Tax Assessment Total Assessment is a certain percentage of the fair market value that is determined by local assessors to be the total taxable value of land and additions on the property. | Land | Improvement |
|---|---|---|---|---|
| 2024 | $4,161 | $218,300 | $63,000 | $155,300 |
| 2023 | $3,163 | $117,700 | $36,800 | $80,900 |
| 2022 | $2,993 | $119,700 | $38,800 | $80,900 |
| 2021 | $2,934 | $119,700 | $38,800 | $80,900 |
| 2020 | $3,074 | $119,700 | $38,800 | $80,900 |
| 2019 | $3,083 | $119,700 | $38,800 | $80,900 |
| 2018 | $3,100 | $104,400 | $27,700 | $76,700 |
| 2017 | $2,940 | $104,400 | $27,700 | $76,700 |
| 2016 | $2,962 | $102,600 | $27,700 | $74,900 |
| 2015 | $2,794 | $102,600 | $27,700 | $74,900 |
| 2014 | $2,700 | $102,600 | $27,700 | $74,900 |
| 2011 | $2,610 | $103,200 | $33,700 | $69,500 |
Source: Public Records
Map
Nearby Homes
- 6 Houghton Point
- 15 Old Homestead Hwy
- 7 Riverton St
- 0 Optical Ave
- 1 Valley Creek Ln Unit 5
- 10 Cranberry Rd
- 46 Belmont Ave
- 425 Marlboro St
- 00 Graves Rd
- 702 Marlboro St
- 319 Matthews Rd
- 323 Matthews Rd
- 00 Marcy Hill Rd
- 431 Main St
- 390 Main St
- 57 Arrowcrest Dr
- 142 Marlboro St
- 14 Branch Rd
- 18-22 Elliot St
- 00 Monadnock Hwy
- 76 & 80 Old Homestead Hwy
- 80 Old Homestead Hwy
- 14 Park St
- 72 Old Homestead Hwy
- 9 Park St
- 75 Old Homestead Hwy
- 68 Old Homestead Hwy
- 68 Old Homestead Hwy
- 15 Park St
- 3 Park St
- 18 Park St
- 3 N Maple St
- 66 Old Homestead Hwy
- 79 Old Homestead Hwy
- 83 Old Homestead Hwy
- 16 Lake St
- 71 Old Homestead Hwy
- 9 N Maple St
- 64 Old Homestead Hwy
- 16 Lake St