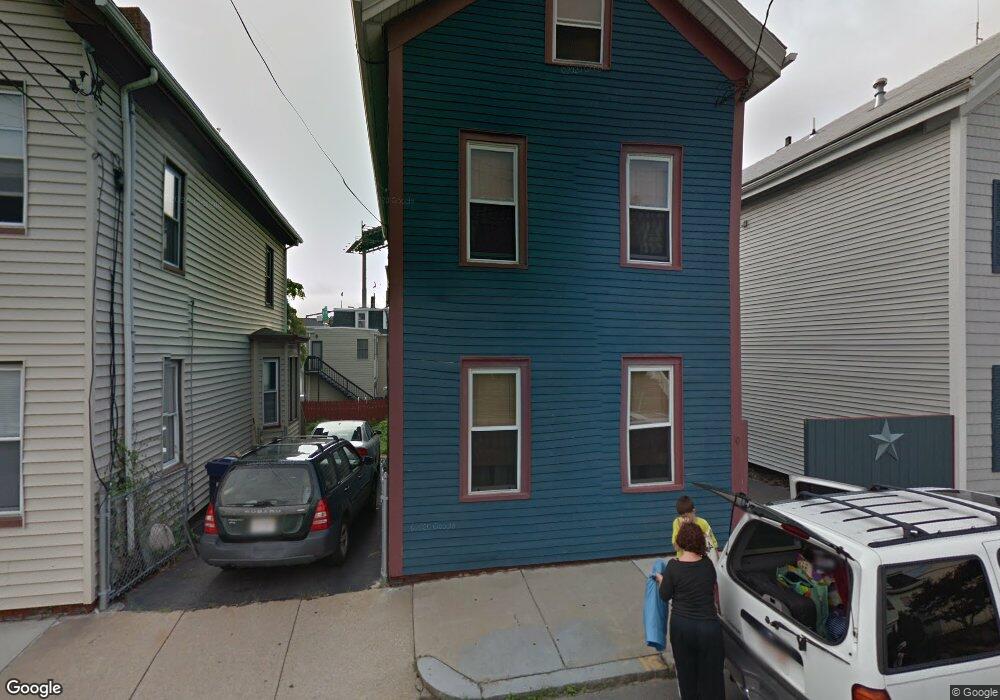
10 Parker St Boston, MA 02129
Medford Street-The Neck NeighborhoodEstimated Value: $1,165,463
3
Beds
3
Baths
2,684
Sq Ft
$434/Sq Ft
Est. Value
About This Home
This home is located at 10 Parker St, Boston, MA 02129 and is currently estimated at $1,165,463, approximately $434 per square foot. 10 Parker St is a home located in Suffolk County with nearby schools including Prospect Hill Academy Upper Elementary Campus and Bright Future Educare Center.
Ownership History
Date
Name
Owned For
Owner Type
Purchase Details
Closed on
Aug 29, 2016
Sold by
Garcia Lucas
Bought by
Collins Brendan and Sharma Biyaja
Current Estimated Value
Home Financials for this Owner
Home Financials are based on the most recent Mortgage that was taken out on this home.
Original Mortgage
$458,000
Outstanding Balance
$365,715
Interest Rate
3.42%
Mortgage Type
New Conventional
Estimated Equity
$805,441
Purchase Details
Closed on
Aug 26, 2015
Sold by
10 Parker Street Rt
Bought by
Garcia Lucas
Home Financials for this Owner
Home Financials are based on the most recent Mortgage that was taken out on this home.
Original Mortgage
$550,000
Interest Rate
4.09%
Mortgage Type
Unknown
Purchase Details
Closed on
Feb 26, 2015
Sold by
Taglilatela Jane and Taglilatela John J
Bought by
10 Parker Street Rt
Home Financials for this Owner
Home Financials are based on the most recent Mortgage that was taken out on this home.
Original Mortgage
$560,000
Interest Rate
3.66%
Mortgage Type
Purchase Money Mortgage
Create a Home Valuation Report for This Property
The Home Valuation Report is an in-depth analysis detailing your home's value as well as a comparison with similar homes in the area
Home Values in the Area
Average Home Value in this Area
Purchase History
| Date | Buyer | Sale Price | Title Company |
|---|---|---|---|
| Collins Brendan | $640,000 | -- | |
| Garcia Lucas | $700,000 | -- | |
| 10 Parker Street Rt | $550,000 | -- |
Source: Public Records
Mortgage History
| Date | Status | Borrower | Loan Amount |
|---|---|---|---|
| Open | Collins Brendan | $458,000 | |
| Previous Owner | Garcia Lucas | $550,000 | |
| Previous Owner | 10 Parker Street Rt | $560,000 |
Source: Public Records
Tax History Compared to Growth
Tax History
| Year | Tax Paid | Tax Assessment Tax Assessment Total Assessment is a certain percentage of the fair market value that is determined by local assessors to be the total taxable value of land and additions on the property. | Land | Improvement |
|---|---|---|---|---|
| 2025 | $0 | $0 | $0 | $0 |
| 2024 | $0 | $0 | $0 | $0 |
| 2023 | $0 | $0 | $0 | $0 |
| 2022 | $4,737 | $0 | $0 | $0 |
| 2021 | $0 | $0 | $0 | $0 |
| 2020 | $0 | $0 | $0 | $0 |
| 2019 | $601 | $0 | $0 | $0 |
| 2018 | $601 | $0 | $0 | $0 |
| 2017 | $601 | $447,300 | $139,200 | $308,100 |
| 2016 | $4,366 | $396,900 | $139,200 | $257,700 |
| 2015 | $4,483 | $370,200 | $159,600 | $210,600 |
| 2014 | -- | $349,300 | $159,600 | $189,700 |
Source: Public Records
Map
Nearby Homes
- 24 Brighton St
- 19 Parker St Unit 3
- 39 Mount Pleasant St
- 7 Washington St
- 32 Pinckney St
- 8 Benedict Ave
- 57 Myrtle St
- 3 Franklin St Unit A
- 3 Franklin St Unit C
- 38 Franklin Ave
- 2 Hillside Ave
- 76 Franklin St
- 9 Short St
- 34 Knowlton St Unit 2
- 9 Armory St
- 100 Baldwin St Unit 1
- 36 Fountain Ave
- 7 Rhode Island Ave
- 84 Cross St
- 4 Cross St
- 10 Parker St
- 10 Parker St Unit 1
- 10 Parker St Unit 2
- 10 Parker St Unit 1
- 10 Parker St Unit 2
- 12 Parker St
- 12 Parker St Unit 1
- 12 Parker St Unit 2
- 8 Parker St
- 8 Parker St Unit 2
- 8 Parker St Unit B
- 8 Parker St Unit 1
- 14 Parker St
- 16 Parker St
- 6 Parker St
- 6 Parker St Unit 1
- 11 Parker St Unit 3
- 11 Parker St Unit 2
- 11 Parker St Unit 1
- 16 Brighton St