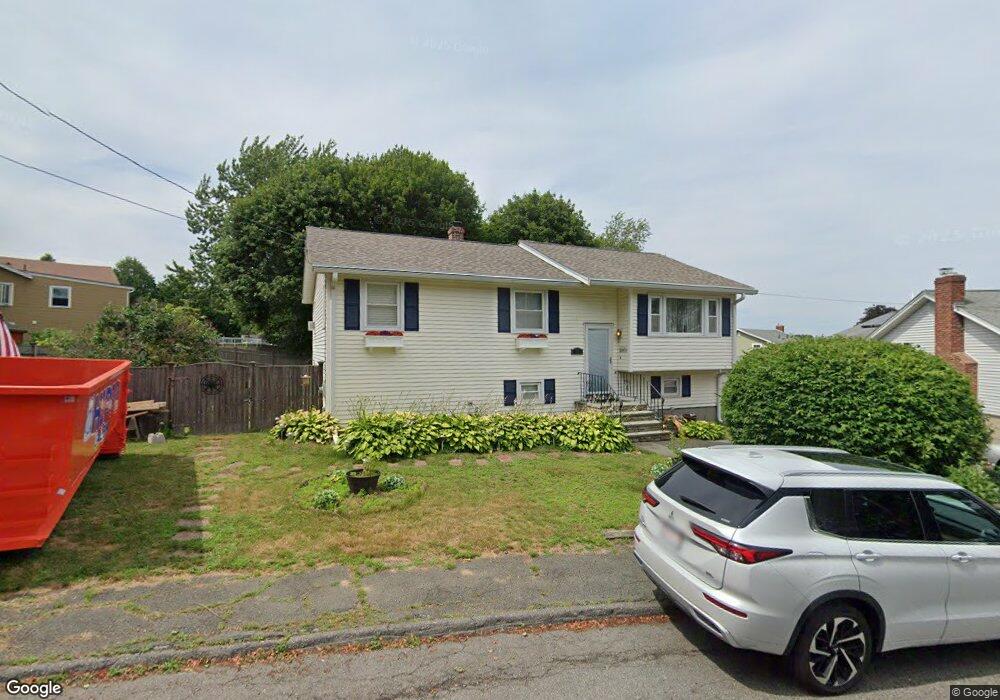
10 Parlee St Salem, MA 01970
Witchcraft Heights NeighborhoodEstimated Value: $631,951 - $712,000
3
Beds
2
Baths
1,848
Sq Ft
$372/Sq Ft
Est. Value
About This Home
This home is located at 10 Parlee St, Salem, MA 01970 and is currently estimated at $687,738, approximately $372 per square foot. 10 Parlee St is a home located in Essex County with nearby schools including Witchcraft Heights Elementary School, Horace Mann Laboratory, and Saltonstall School.
Ownership History
Date
Name
Owned For
Owner Type
Purchase Details
Closed on
Jun 17, 2024
Sold by
Gamilon Raymond G and Hamilton Barbara A
Bought by
Hamilton Ft and Hamilton
Current Estimated Value
Purchase Details
Closed on
Aug 29, 1996
Sold by
Pappas Richard T
Bought by
Hamilton Raymond G
Home Financials for this Owner
Home Financials are based on the most recent Mortgage that was taken out on this home.
Original Mortgage
$147,250
Interest Rate
8.18%
Mortgage Type
Purchase Money Mortgage
Create a Home Valuation Report for This Property
The Home Valuation Report is an in-depth analysis detailing your home's value as well as a comparison with similar homes in the area
Home Values in the Area
Average Home Value in this Area
Purchase History
| Date | Buyer | Sale Price | Title Company |
|---|---|---|---|
| Hamilton Ft | -- | None Available | |
| Hamilton Ft | -- | None Available | |
| Hamilton Raymond G | $155,000 | -- | |
| Hamilton Raymond G | $155,000 | -- | |
| Hamilton Raymond G | $155,000 | -- |
Source: Public Records
Mortgage History
| Date | Status | Borrower | Loan Amount |
|---|---|---|---|
| Previous Owner | Hamilton Raymond G | $147,250 | |
| Previous Owner | Hamilton Raymond G | $25,000 |
Source: Public Records
Tax History Compared to Growth
Tax History
| Year | Tax Paid | Tax Assessment Tax Assessment Total Assessment is a certain percentage of the fair market value that is determined by local assessors to be the total taxable value of land and additions on the property. | Land | Improvement |
|---|---|---|---|---|
| 2025 | $6,168 | $543,900 | $233,200 | $310,700 |
| 2024 | $6,153 | $529,500 | $220,100 | $309,400 |
| 2023 | $5,933 | $474,300 | $200,400 | $273,900 |
| 2022 | $5,676 | $428,400 | $183,900 | $244,500 |
| 2021 | $5,505 | $398,900 | $170,800 | $228,100 |
| 2020 | $5,647 | $390,800 | $167,500 | $223,300 |
| 2019 | $5,592 | $370,300 | $157,700 | $212,600 |
| 2018 | $5,343 | $347,400 | $147,200 | $200,200 |
| 2017 | $5,120 | $322,800 | $138,000 | $184,800 |
| 2016 | $5,058 | $322,800 | $138,000 | $184,800 |
| 2015 | $4,788 | $291,800 | $121,500 | $170,300 |
Source: Public Records
Map
Nearby Homes