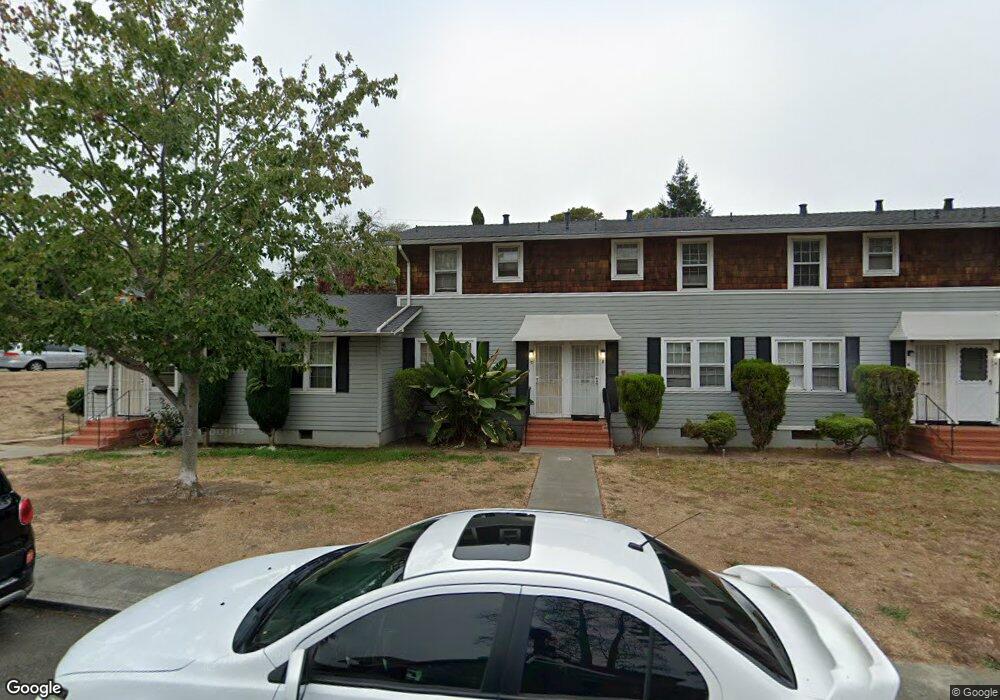
10 Parrott St Unit 262 Vallejo, CA 94590
Vallejo Heights NeighborhoodEstimated Value: $260,938 - $278,000
2
Beds
1
Bath
884
Sq Ft
$308/Sq Ft
Est. Value
About This Home
This home is located at 10 Parrott St Unit 262, Vallejo, CA 94590 and is currently estimated at $272,235, approximately $307 per square foot. 10 Parrott St Unit 262 is a home located in Solano County with nearby schools including Federal Terrace Elementary School, Vallejo High School, and Caliber: ChangeMakers Academy.
Ownership History
Date
Name
Owned For
Owner Type
Purchase Details
Closed on
Feb 7, 2019
Sold by
Bagatelos Michael
Bought by
Bagatelos Michael A and Michael A Bagatelos Revocable
Current Estimated Value
Purchase Details
Closed on
Dec 15, 2016
Sold by
Fornari Cody
Bought by
Bagatelos Michael
Purchase Details
Closed on
Mar 4, 2013
Sold by
Mabco Investments Llc
Bought by
Bagatelos Michael A and Fornari Cody
Purchase Details
Closed on
Feb 27, 2013
Sold by
Lewis D Andre and Anderson Sharri L
Bought by
Mabco Investments Llc
Purchase Details
Closed on
Apr 11, 2001
Sold by
Ashburn Andrew Paul and Rockwood Carrie E
Bought by
Anderson Priscilla
Home Financials for this Owner
Home Financials are based on the most recent Mortgage that was taken out on this home.
Original Mortgage
$104,462
Interest Rate
6.98%
Mortgage Type
FHA
Create a Home Valuation Report for This Property
The Home Valuation Report is an in-depth analysis detailing your home's value as well as a comparison with similar homes in the area
Home Values in the Area
Average Home Value in this Area
Purchase History
| Date | Buyer | Sale Price | Title Company |
|---|---|---|---|
| Bagatelos Michael A | -- | None Available | |
| Bagatelos Michael | $10,000 | None Available | |
| Bagatelos Michael A | $23,500 | None Available | |
| Mabco Investments Llc | $23,481 | First American Title | |
| Anderson Priscilla | $107,000 | Placer Title Company |
Source: Public Records
Mortgage History
| Date | Status | Borrower | Loan Amount |
|---|---|---|---|
| Previous Owner | Anderson Priscilla | $104,462 |
Source: Public Records
Tax History Compared to Growth
Tax History
| Year | Tax Paid | Tax Assessment Tax Assessment Total Assessment is a certain percentage of the fair market value that is determined by local assessors to be the total taxable value of land and additions on the property. | Land | Improvement |
|---|---|---|---|---|
| 2025 | $2,162 | $95,379 | $26,462 | $68,917 |
| 2024 | $2,162 | $93,510 | $25,944 | $67,566 |
| 2023 | $1,998 | $91,678 | $25,436 | $66,242 |
| 2022 | $1,876 | $89,882 | $24,939 | $64,943 |
| 2021 | $1,832 | $88,120 | $24,450 | $63,670 |
| 2020 | $1,815 | $87,218 | $24,200 | $63,018 |
| 2019 | $1,736 | $85,509 | $23,726 | $61,783 |
| 2018 | $1,608 | $83,833 | $23,261 | $60,572 |
| 2017 | $1,512 | $82,190 | $22,805 | $59,385 |
| 2016 | $497 | $40,568 | $10,401 | $30,167 |
| 2015 | $491 | $39,959 | $10,245 | $29,714 |
| 2014 | $485 | $39,177 | $10,045 | $29,132 |
Source: Public Records
Map
Nearby Homes
- 2269 Sacramento St
- 44 Parrott St
- 2289 Sacramento St
- 43 Rodgers St
- 69 Baldwin St
- 61 Parrott St
- 702 Daniels Ave
- 1 Frisbie St Unit 415
- 1 Frisbie St Unit 521
- 120 Scenic Way
- 290 Frisbie St
- 164 Calhoun St
- 110 Harrier Ave
- 112 Harrier Ave
- 127 Hill Dr
- 25 Burnham St
- 60 D St
- 1800 Santa Clara St
- 247 Coughlan St
- 25 Missouri St
- 8 Parrott St
- 6 Parrott St Unit 264
- 4 Parrott St Unit 265
- 12 Parrott St
- 2 Parrott St
- 2 Werden St
- 4 Werden St
- 1 Parrott St
- 8 Werden St
- 2239 Sacramento St
- 5 Parrott St
- 10 Werden St
- 3 Parrott St
- 2241 Sacramento St
- 14 Parrott St
- 7 Parrott St
- 2243 Sacramento St
- 1 Werden St Unit 225
- 9 Parrott St
- 3 Werden St Unit 226