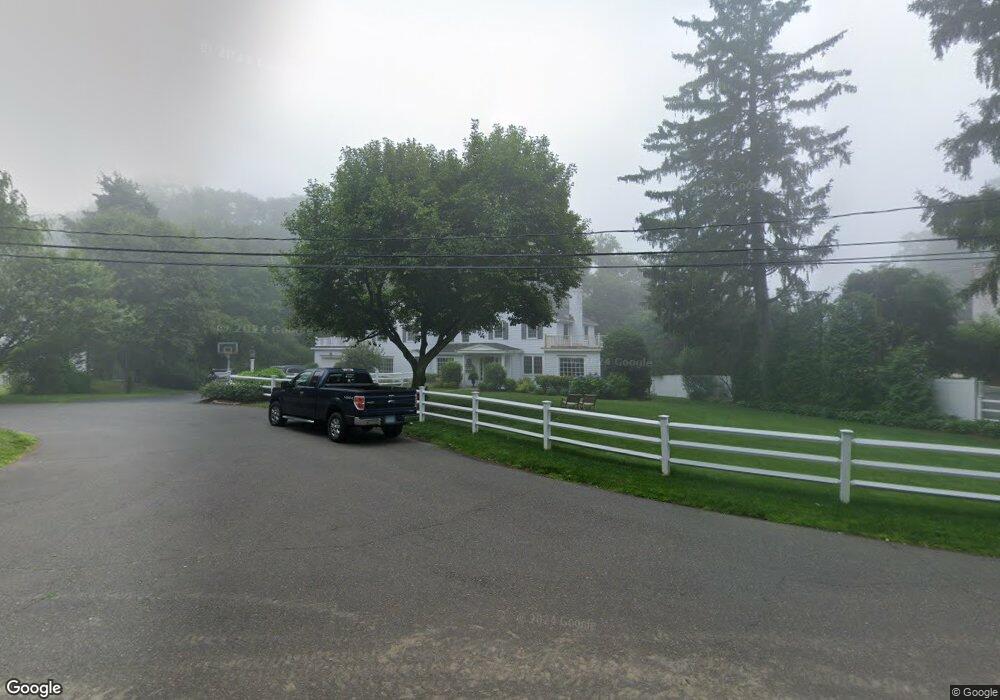
10 Partridge Ln Darien, CT 06820
Estimated Value: $2,302,000 - $2,766,000
4
Beds
3
Baths
3,046
Sq Ft
$837/Sq Ft
Est. Value
About This Home
This home is located at 10 Partridge Ln, Darien, CT 06820 and is currently estimated at $2,549,226, approximately $836 per square foot. 10 Partridge Ln is a home located in Fairfield County with nearby schools including Royle Elementary School, Middlesex Middle School, and Darien High School.
Ownership History
Date
Name
Owned For
Owner Type
Purchase Details
Closed on
Mar 5, 2004
Sold by
Mcfall J Kevin and Mcfall Maria
Bought by
Balanoff Glen C and Balanoff Kathryn H
Current Estimated Value
Purchase Details
Closed on
Jul 31, 2001
Sold by
Dougherty Patrick W and Dougherty Carol L
Bought by
Mcfall J Kevin and Mcfall Maria
Purchase Details
Closed on
Aug 23, 2000
Sold by
Ellis Mark J and Ellis Janet D
Bought by
Dougherty Patrick W and Dougherty Carol L
Purchase Details
Closed on
Apr 15, 1998
Sold by
Suburban Renovation 2
Bought by
Ellis Mark J and Ellis Janet D
Purchase Details
Closed on
Jan 21, 1997
Sold by
Macvickar Kathryn M
Bought by
Suburban Renovations
Create a Home Valuation Report for This Property
The Home Valuation Report is an in-depth analysis detailing your home's value as well as a comparison with similar homes in the area
Home Values in the Area
Average Home Value in this Area
Purchase History
| Date | Buyer | Sale Price | Title Company |
|---|---|---|---|
| Balanoff Glen C | $1,346,000 | -- | |
| Mcfall J Kevin | $995,000 | -- | |
| Dougherty Patrick W | $908,500 | -- | |
| Ellis Mark J | $745,000 | -- | |
| Suburban Renovations | $385,000 | -- | |
| Balanoff Glen C | $1,346,000 | -- | |
| Mcfall J Kevin J | $995,000 | -- | |
| Dougherty Patrick W | $908,500 | -- | |
| Ellis Mark J | $745,000 | -- | |
| Suburban Renovations | $385,000 | -- |
Source: Public Records
Mortgage History
| Date | Status | Borrower | Loan Amount |
|---|---|---|---|
| Open | Suburban Renovations | $835,000 | |
| Closed | Suburban Renovations | $880,000 |
Source: Public Records
Tax History Compared to Growth
Tax History
| Year | Tax Paid | Tax Assessment Tax Assessment Total Assessment is a certain percentage of the fair market value that is determined by local assessors to be the total taxable value of land and additions on the property. | Land | Improvement |
|---|---|---|---|---|
| 2025 | $18,324 | $1,183,700 | $713,720 | $469,980 |
| 2024 | $17,389 | $1,183,700 | $713,720 | $469,980 |
| 2023 | $15,401 | $874,580 | $512,820 | $361,760 |
| 2022 | $15,069 | $874,580 | $512,820 | $361,760 |
| 2021 | $14,728 | $874,580 | $512,820 | $361,760 |
| 2020 | $14,308 | $874,580 | $512,820 | $361,760 |
| 2019 | $14,404 | $874,580 | $512,820 | $361,760 |
| 2018 | $16,312 | $1,014,440 | $607,670 | $406,770 |
| 2017 | $16,393 | $1,014,440 | $607,670 | $406,770 |
| 2016 | $15,998 | $1,014,440 | $607,670 | $406,770 |
| 2015 | $15,572 | $1,014,440 | $607,670 | $406,770 |
| 2014 | $15,227 | $1,014,440 | $607,670 | $406,770 |
Source: Public Records
Map
Nearby Homes
- 93 Mansfield Ave
- 10 Prospect Ave
- 10 Stony Brook Rd
- 8 Sedgewick Village Ln
- 6 Priscilla Ln
- 10 Pine Brook Ln
- 17 Pine Brook Ln Unit 17
- 51 Hale Ln Unit 51
- 128 West Ave
- 130 West Ave
- 20 Locust Hill Rd
- 17 Brushy Hill Rd
- 5 Wakeman Rd
- 45 Hecker Ave
- 311 Noroton Ave
- 19 Littlebrook Rd
- 39 Noroton Ave
- 261 Hollow Tree Ridge Rd
- 561 Middlesex Rd
- 97 Richards Ave Unit B10
- 20 Robin Hood Ln
- 8 Partridge Ln
- 12 Partridge Ln
- 18 Robin Hood Ln
- Lot 130 Leroy Ave
- Lot 132 Leroy Ave
- 126 Leroy Ave
- 6 Partridge Ln
- 132 Leroy Ave
- 22 Robin Hood Ln
- 16 Robin Hood Ln
- 130 Leroy Ave
- 124 Leroy Ave
- 81 Mansfield Ave
- 12 Robin Hood Ln
- 19 Robin Hood Ln
- 4 Partridge Ln
- 10 Rock Spring Ln
- 4 Rock Spring Ln
- 10 Robin Hood Ln