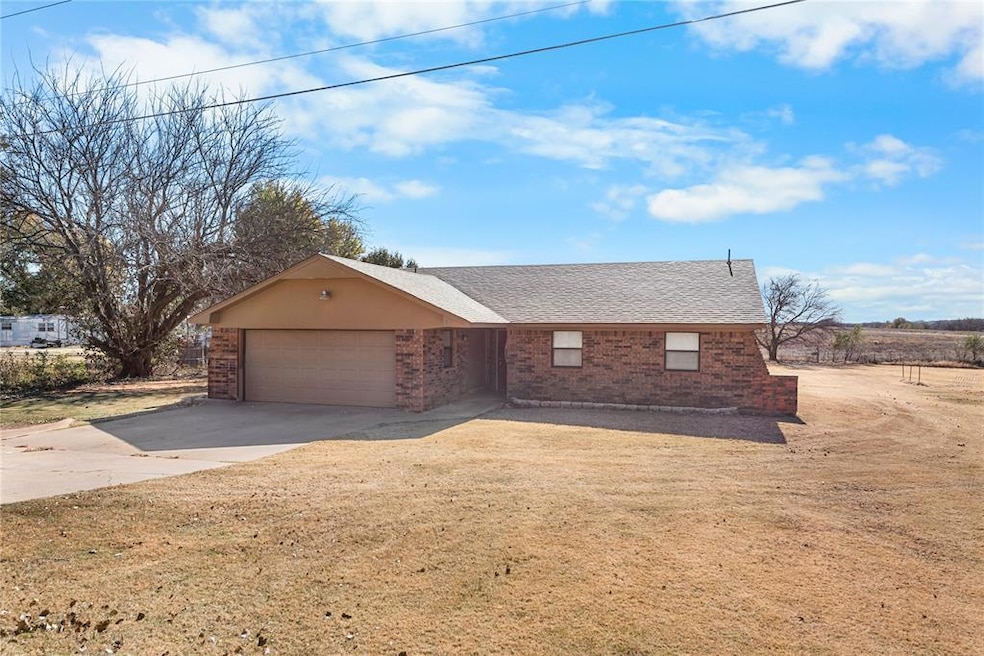
10 Peach St Ninnekah, OK 73067
Estimated payment $1,103/month
Highlights
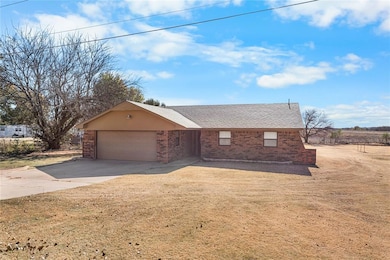
- Ranch Style House
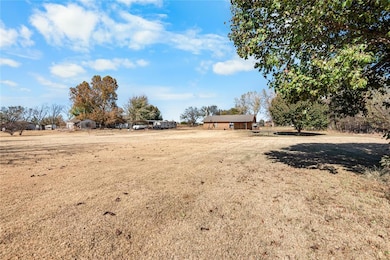
- Interior Lot
- Central Heating and Cooling System
- 2 Car Attached Garage
- Covered Deck
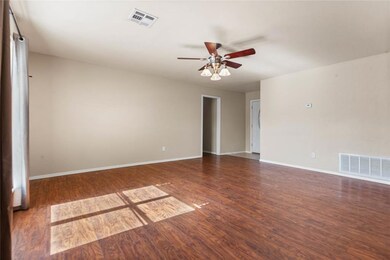
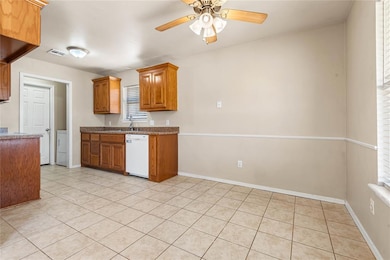
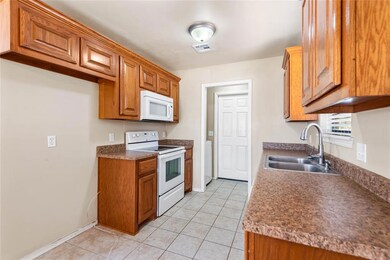
About This Home
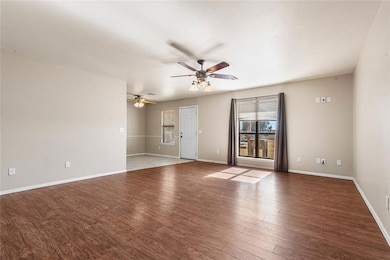
Freshly painted and move-in ready, this charming 3-bed, 2-bath home sits on a full acre and is one of the best values in the area. Enjoy comfortable single-level living, an attached garage, and plenty of outdoor space for privacy or projects. A solid 1982 build offering unbeatable affordability in Ninnekah.
Home Details
Home Type
- Single Family
Est. Annual Taxes
- $2,455
Year Built
- Built in 1982
Lot Details
- 1 Acre Lot
- Interior Lot
Parking
- 2 Car Attached Garage
Home Design
- 1,341 Sq Ft Home
- Ranch Style House
- Slab Foundation
- Brick Frame
- Composition Roof
Bedrooms and Bathrooms
- 3 Bedrooms
- 2 Full Bathrooms
Schools
- Ninnekah Elementary School
- Ninnekah Middle School
- Senior High School
Additional Features
- Covered Deck
- Central Heating and Cooling System
Listing and Financial Details
- Tax Lot 3
Map
Home Values in the Area
Average Home Value in this Area
Tax History
| Year | Tax Paid | Tax Assessment Tax Assessment Total Assessment is a certain percentage of the fair market value that is determined by local assessors to be the total taxable value of land and additions on the property. | Land | Improvement |
|---|---|---|---|---|
| 2025 | $2,455 | $13,554 | $1,460 | $12,094 |
| 2024 | $1,367 | $12,909 | $1,391 | $11,518 |
| 2023 | $1,367 | $12,294 | $1,925 | $10,369 |
| 2022 | $1,233 | $11,942 | $1,452 | $10,490 |
| 2021 | $1,285 | $12,261 | $1,452 | $10,809 |
| 2020 | $1,276 | $12,206 | $1,452 | $10,754 |
| 2019 | $1,265 | $11,770 | $1,100 | $10,670 |
| 2018 | $840 | $8,904 | $1,100 | $7,804 |
| 2017 | $838 | $9,080 | $1,100 | $7,980 |
| 2016 | $923 | $9,465 | $1,100 | $8,365 |
| 2015 | $871 | $9,328 | $1,100 | $8,228 |
| 2014 | $871 | $10,263 | $1,100 | $9,163 |
Property History
| Date | Event | Price | List to Sale | Price per Sq Ft |
|---|---|---|---|---|
| 11/13/2025 11/13/25 | For Sale | $170,000 | -- | $127 / Sq Ft |
Purchase History
| Date | Type | Sale Price | Title Company |
|---|---|---|---|
| Warranty Deed | -- | Element Title | |
| Warranty Deed | -- | Element Title | |
| Warranty Deed | $107,500 | American Security Title Insu | |
| Warranty Deed | $92,000 | None Available |
Mortgage History
| Date | Status | Loan Amount | Loan Type |
|---|---|---|---|
| Previous Owner | $105,552 | FHA | |
| Previous Owner | $89,667 | FHA |
Source: MLSOK
MLS Number: 1201485
APN: 0000-03-05N-07W-2-002-00
Disclaimer: Certain information contained herein is derived from information provided by parties other than Homes.com. All information provided is deemed reliable, but is not guaranteed to be accurate and should be independently verified.
![]() IDX information is provided exclusively for personal, non-commercial use, and may not be used for any purpose other than to identify prospective properties consumers may be interested in purchasing.
IDX information is provided exclusively for personal, non-commercial use, and may not be used for any purpose other than to identify prospective properties consumers may be interested in purchasing.
Information is deemed reliable but not guaranteed.
This information is not verified for authenticity or accuracy, is not guaranteed and may not reflect all real estate activity in the market.
Copyright 2025 MLSOK, Inc. All rights reserved.
- 1210 Walnut St
- 0 S Waterfront Dr
- 212 N Old Highway 81
- 1108 W Highway 277
- 3595 U S 81
- 0 0000-21-06n-07w-1-024-00 Unit 1174503
- 416 Quail Rd
- 659 Quail Rd
- 108 Sterling Dr
- 112 Sterling Dr
- 116 Sterling Dr
- 122 Sterling Dr
- 119 Windsor Dr
- 126 Windsor Dr
- 1420 County Road 1420
- 0 County Street 2870
- 0 Pikes Peak Rd
- 3918 S 4th St
- 1311 County Road 1390
- 0 County Road 1390
- 116 Sterling Dr
- 201 E Almar Dr
- 2303 Ridge Way
- 2923 Russell Rd
- 2032 Dillards Dr
- 605 Marlin Ct
- 801 S 5th St
- 828 S 16th St
- 634 Marlin Ct
- 110 S 9th St
- 812 W Illinois Ave
- 2200 Highway 81 N
- 2291 County Road 1324
- 2299 County Road 1324
- 718 SW 11th St
- 119 S Harrison Ave
- 21128 Sandy Creek Ln
- 2172 Emily Rae Ln
- 2372 Anne Ln
- 275 Jennifer Dr
