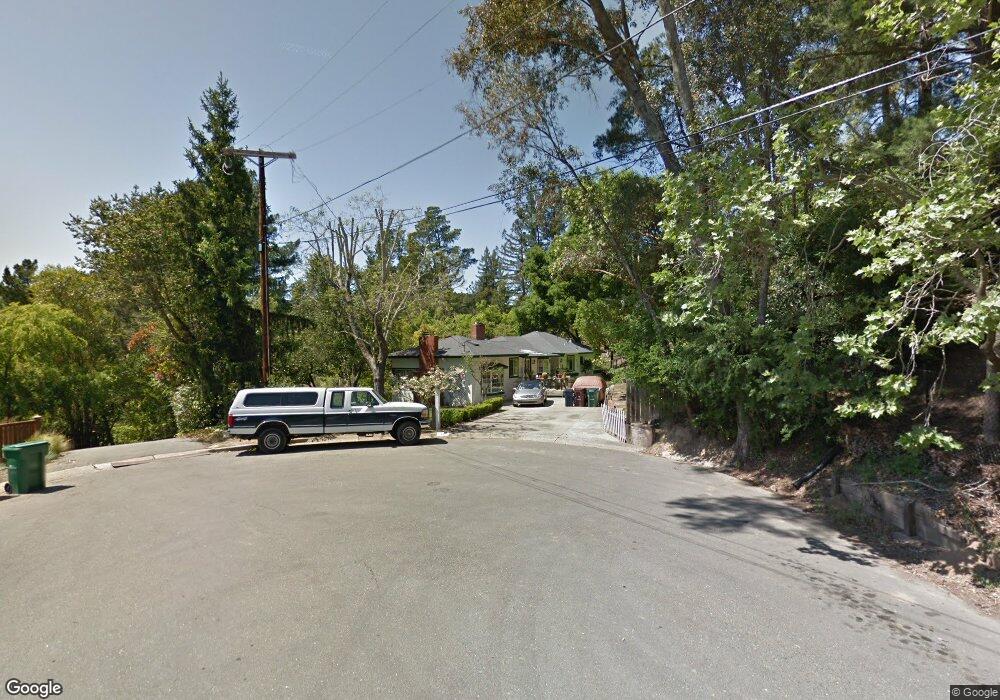
10 Pico Ct Orinda, CA 94563
Del Rey NeighborhoodEstimated Value: $1,882,000 - $2,313,000
5
Beds
3
Baths
2,827
Sq Ft
$750/Sq Ft
Est. Value
About This Home
This home is located at 10 Pico Ct, Orinda, CA 94563 and is currently estimated at $2,119,328, approximately $749 per square foot. 10 Pico Ct is a home located in Contra Costa County with nearby schools including Del Rey Elementary School, Orinda Intermediate School, and Miramonte High School.
Ownership History
Date
Name
Owned For
Owner Type
Purchase Details
Closed on
Jan 14, 2020
Sold by
Levine Barrett G
Bought by
Levine Barrett G
Current Estimated Value
Purchase Details
Closed on
Apr 12, 2016
Sold by
Stubblefield Bradley O and Stubblefield Brooks
Bought by
Levine Barrett G
Purchase Details
Closed on
Mar 20, 2002
Sold by
Strubblefield Bradley O
Bought by
Stubblefield Bradley O and Stubblefield Brooks
Purchase Details
Closed on
Oct 18, 2001
Sold by
Stubblefield Brooks L
Bought by
Stubblefield Bradley O
Home Financials for this Owner
Home Financials are based on the most recent Mortgage that was taken out on this home.
Original Mortgage
$229,000
Interest Rate
6.88%
Mortgage Type
Purchase Money Mortgage
Create a Home Valuation Report for This Property
The Home Valuation Report is an in-depth analysis detailing your home's value as well as a comparison with similar homes in the area
Home Values in the Area
Average Home Value in this Area
Purchase History
| Date | Buyer | Sale Price | Title Company |
|---|---|---|---|
| Levine Barrett G | -- | First American Title | |
| Levine Barrett G | $1,312,000 | Old Republic Title Company | |
| Stubblefield Bradley O | -- | First American Title Guarant | |
| Stubblefield Bradley O | -- | First American Title Guarant |
Source: Public Records
Mortgage History
| Date | Status | Borrower | Loan Amount |
|---|---|---|---|
| Previous Owner | Stubblefield Bradley O | $229,000 |
Source: Public Records
Tax History Compared to Growth
Tax History
| Year | Tax Paid | Tax Assessment Tax Assessment Total Assessment is a certain percentage of the fair market value that is determined by local assessors to be the total taxable value of land and additions on the property. | Land | Improvement |
|---|---|---|---|---|
| 2025 | $19,846 | $1,592,602 | $1,316,497 | $276,105 |
| 2024 | $19,516 | $1,561,376 | $1,290,684 | $270,692 |
| 2023 | $19,516 | $1,530,762 | $1,265,377 | $265,385 |
| 2022 | $18,994 | $1,500,748 | $1,240,566 | $260,182 |
| 2021 | $18,614 | $1,471,323 | $1,216,242 | $255,081 |
| 2019 | $18,386 | $1,427,684 | $1,180,168 | $247,516 |
| 2018 | $16,642 | $1,364,691 | $1,157,028 | $207,663 |
| 2017 | $16,191 | $1,337,934 | $1,134,342 | $203,592 |
| 2016 | $2,891 | $133,139 | $57,117 | $76,022 |
| 2015 | $2,854 | $131,141 | $56,260 | $74,881 |
| 2014 | $2,803 | $128,573 | $55,158 | $73,415 |
Source: Public Records
Map
Nearby Homes
- 33 Altamount Dr
- 12 La Cresta Rd
- 24 Valencia Rd
- 13 Carmen Ct
- 8 Southwaite Ct
- 12 Lost Valley Dr
- 81 Coral Dr
- 42 Crestview Dr
- 2 Dolores Way
- 40 Hilldale Ct
- 5 Corte Sombrita
- 47 Miramonte Dr
- 231 Orchard Rd
- 62 Warfield Dr
- 58 Ashbrook Place
- 205 Crestview Dr
- 128 Glorietta Blvd
- 82 Zander Dr
- 58 Zander Ct
- 1725 Spyglass Ln