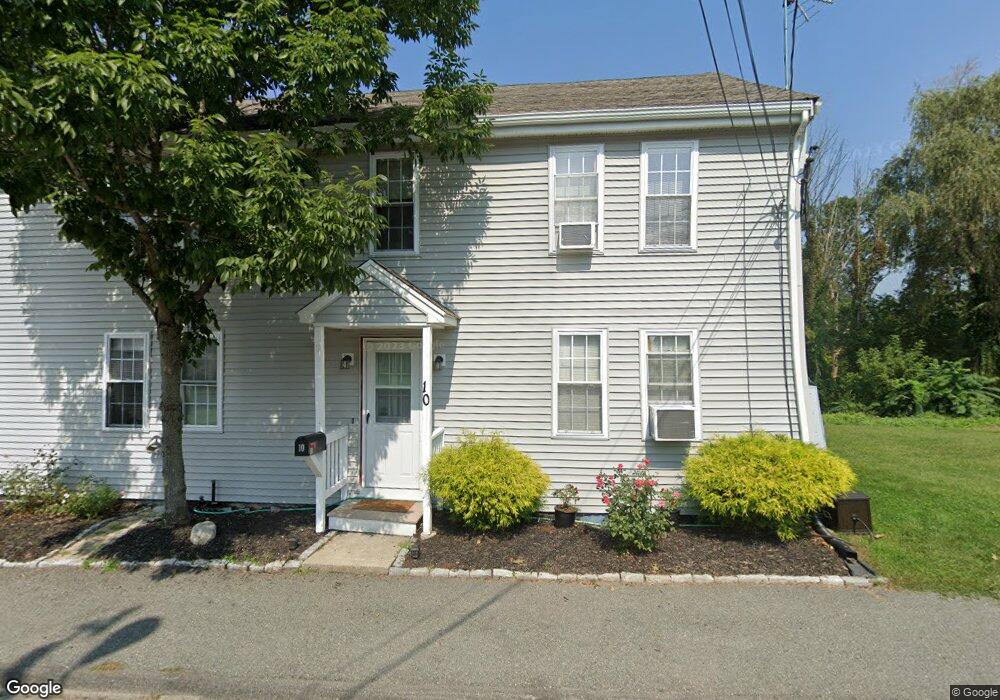
10 Plain St Bellingham, MA 02019
Estimated Value: $365,000 - $377,263
3
Beds
2
Baths
1,310
Sq Ft
$283/Sq Ft
Est. Value
About This Home
This home is located at 10 Plain St, Bellingham, MA 02019 and is currently estimated at $370,816, approximately $283 per square foot. 10 Plain St is a home located in Norfolk County with nearby schools including Stall Brook Elementary School, Bellingham High School, and Woodside Montessori Academy.
Ownership History
Date
Name
Owned For
Owner Type
Purchase Details
Closed on
Oct 29, 2010
Sold by
J & M Homes Llc
Bought by
Vitale Jamie P and Vitale James P
Current Estimated Value
Home Financials for this Owner
Home Financials are based on the most recent Mortgage that was taken out on this home.
Original Mortgage
$120,000
Outstanding Balance
$79,657
Interest Rate
4.39%
Mortgage Type
Purchase Money Mortgage
Estimated Equity
$291,159
Purchase Details
Closed on
Jan 16, 2009
Sold by
Wells Fargo Bk
Bought by
J & M Homes Llc
Purchase Details
Closed on
Feb 21, 2007
Sold by
Fleming Lisa H and Option One Mtg Corp
Bought by
Wells Fargo Bk Na
Purchase Details
Closed on
May 31, 2005
Sold by
Patel Kalidas
Bought by
Fleming Lisa H
Purchase Details
Closed on
Aug 13, 2003
Sold by
10 Plain Street Llc
Bought by
Hollingsworth Pond Llc
Purchase Details
Closed on
Jul 12, 1996
Sold by
Armstrong World Ind
Bought by
10 Plain St Llc
Create a Home Valuation Report for This Property
The Home Valuation Report is an in-depth analysis detailing your home's value as well as a comparison with similar homes in the area
Home Values in the Area
Average Home Value in this Area
Purchase History
| Date | Buyer | Sale Price | Title Company |
|---|---|---|---|
| Vitale Jamie P | $160,000 | -- | |
| Vitale Jamie P | $160,000 | -- | |
| J & M Homes Llc | $73,500 | -- | |
| J&M Homes Llc | $73,500 | -- | |
| Wells Fargo Bk Na | $229,500 | -- | |
| Wells Fargo Bk Na | $229,500 | -- | |
| Fleming Lisa H | $264,000 | -- | |
| Fleming Lisa H | $264,000 | -- | |
| Hollingsworth Pond Llc | $9,020,000 | -- | |
| 10 Plain St Llc | $4,500,000 | -- |
Source: Public Records
Mortgage History
| Date | Status | Borrower | Loan Amount |
|---|---|---|---|
| Open | Vitale Jamie P | $120,000 | |
| Closed | 10 Plain St Llc | $120,000 | |
| Previous Owner | 10 Plain St Llc | $179,600 |
Source: Public Records
Tax History Compared to Growth
Tax History
| Year | Tax Paid | Tax Assessment Tax Assessment Total Assessment is a certain percentage of the fair market value that is determined by local assessors to be the total taxable value of land and additions on the property. | Land | Improvement |
|---|---|---|---|---|
| 2025 | $3,612 | $287,600 | $0 | $287,600 |
| 2024 | $3,600 | $279,900 | $0 | $279,900 |
| 2023 | $3,166 | $242,600 | $0 | $242,600 |
| 2022 | $3,048 | $216,500 | $0 | $216,500 |
| 2021 | $3,022 | $209,700 | $0 | $209,700 |
| 2020 | $2,844 | $200,000 | $0 | $200,000 |
| 2019 | $2,613 | $183,900 | $0 | $183,900 |
| 2018 | $2,581 | $179,100 | $0 | $179,100 |
| 2017 | $2,489 | $173,600 | $0 | $173,600 |
| 2016 | $2,498 | $174,800 | $0 | $174,800 |
| 2015 | $2,491 | $174,800 | $0 | $174,800 |
| 2014 | $2,533 | $172,800 | $0 | $172,800 |
Source: Public Records
Map
Nearby Homes
- 455 Hartford Ave
- 462 Hartford Ave
- 18 Mary Anne Dr
- 0 Old Log Lane (Farm St) Unit 73416329
- 14 Hawthorne Village Unit D
- 387 Hartford Ave
- 39 West St
- 21 Riverside Rd
- 951 Pond St
- 220 Main St Unit 220
- 5 Fales St
- 6 Freedom Trail
- 9 Tulip Way
- 17 Pine St
- 28 Wellington St
- 22 Granite St
- 176 Main St Unit 3
- 4 Shaw St
- 280 Village St Unit D2
- 6 Rainbow Dr