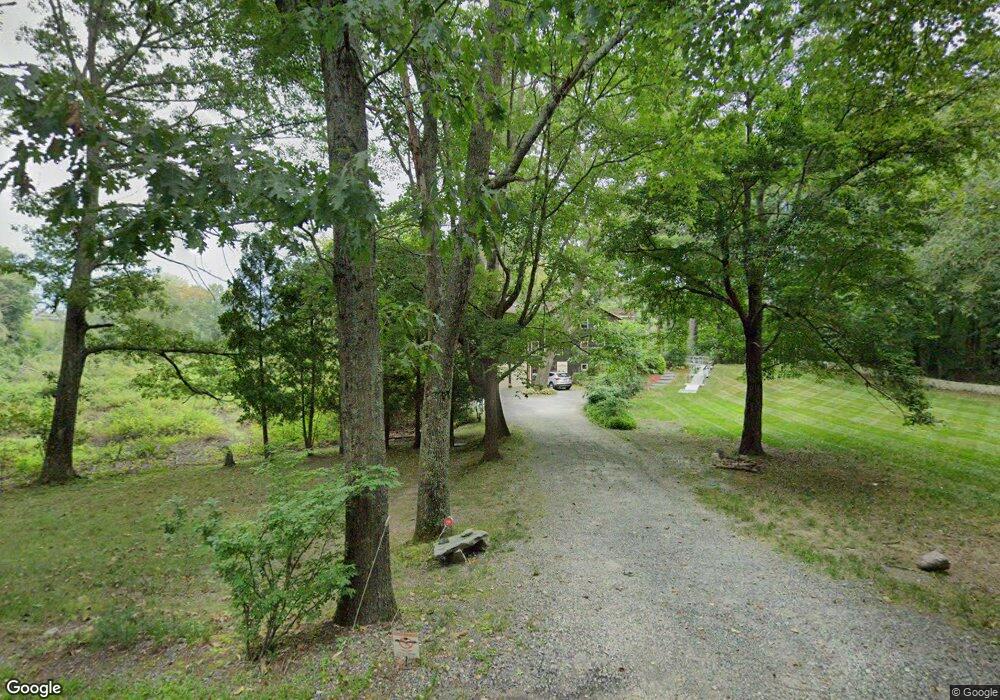
10 Populatic St Franklin, MA 02038
Estimated Value: $914,000 - $1,244,000
4
Beds
4
Baths
3,690
Sq Ft
$298/Sq Ft
Est. Value
About This Home
This home is located at 10 Populatic St, Franklin, MA 02038 and is currently estimated at $1,099,938, approximately $298 per square foot. 10 Populatic St is a home located in Norfolk County with nearby schools including Helen Keller Elementary School, Annie Sullivan Middle School, and Franklin High School.
Ownership History
Date
Name
Owned For
Owner Type
Purchase Details
Closed on
May 31, 2018
Sold by
10 Populatic St Ext T
Bought by
Maksakov Artem
Current Estimated Value
Purchase Details
Closed on
Oct 17, 2017
Sold by
Morrison Scott W and Morrison Maureen A
Bought by
10 Populatic St Ext T
Purchase Details
Closed on
Nov 16, 2009
Sold by
Mosca Gary J and Bushman-Mosca Alexis D
Bought by
Tuerck David G and Popat Prema P
Home Financials for this Owner
Home Financials are based on the most recent Mortgage that was taken out on this home.
Original Mortgage
$408,000
Interest Rate
4.98%
Mortgage Type
Purchase Money Mortgage
Create a Home Valuation Report for This Property
The Home Valuation Report is an in-depth analysis detailing your home's value as well as a comparison with similar homes in the area
Home Values in the Area
Average Home Value in this Area
Purchase History
| Date | Buyer | Sale Price | Title Company |
|---|---|---|---|
| Maksakov Artem | $432,500 | -- | |
| 10 Populatic St Ext T | $187,200 | -- | |
| Tuerck David G | $510,000 | -- |
Source: Public Records
Mortgage History
| Date | Status | Borrower | Loan Amount |
|---|---|---|---|
| Previous Owner | Tuerck David G | $408,000 |
Source: Public Records
Tax History Compared to Growth
Tax History
| Year | Tax Paid | Tax Assessment Tax Assessment Total Assessment is a certain percentage of the fair market value that is determined by local assessors to be the total taxable value of land and additions on the property. | Land | Improvement |
|---|---|---|---|---|
| 2025 | $12,180 | $1,048,200 | $255,200 | $793,000 |
| 2024 | $10,309 | $874,400 | $255,200 | $619,200 |
| 2023 | $10,321 | $820,400 | $257,300 | $563,100 |
| 2022 | $9,957 | $708,700 | $212,700 | $496,000 |
| 2021 | $9,435 | $644,000 | $227,800 | $416,200 |
| 2020 | $9,027 | $622,100 | $229,800 | $392,300 |
| 2019 | $8,802 | $600,400 | $208,200 | $392,200 |
| 2018 | $8,295 | $566,200 | $214,100 | $352,100 |
| 2017 | $7,997 | $548,500 | $196,400 | $352,100 |
| 2016 | $7,424 | $512,000 | $193,400 | $318,600 |
| 2015 | $7,528 | $507,300 | $188,700 | $318,600 |
| 2014 | $6,894 | $477,100 | $158,500 | $318,600 |
Source: Public Records
Map
Nearby Homes
- 56 Fuller Place
- 9 Sanford St
- 14 Sanford St Unit 15
- 841 Lincoln St
- 10 Populatic Street Extension
- 20 Broad St Unit 6
- 20 Broad St Unit A
- 20 Broad St Unit 4
- 48 River Rd
- 16 Lexington Ln
- 312 Eagles Nest Way Unit 312
- 2 Skyline Dr
- 99 Leland Rd
- 24 Shayne Rd Unit 219
- 10 Silver Fox Rd
- 1 Granite Dr
- 48 Leanne Way Unit 48
- 732 Lincoln St
- 83 Oliver Pond Cir Unit 7
- 91 Oliver Pond Cir Unit 3
- 39 Populatic St
- 3 Populatic St
- 1 Populatic St
- 37 Populatic St
- 1 Populatic St
- 35 Populatic St
- 34 Populatic St
- 9 Secret Garden Ln
- 5 Secret Garden Ln
- 10 Secret Garden Ln
- 51 Fuller Place
- 6 Secret Garden Ln
- 0 Confidential St Unit 72332373
- 26 Populatic St
- 41 Fuller Place
- 39 Fuller Place
- 31 Fuller Place
- 33 Village St
- 24 Populatic St
- 55 Fuller Place