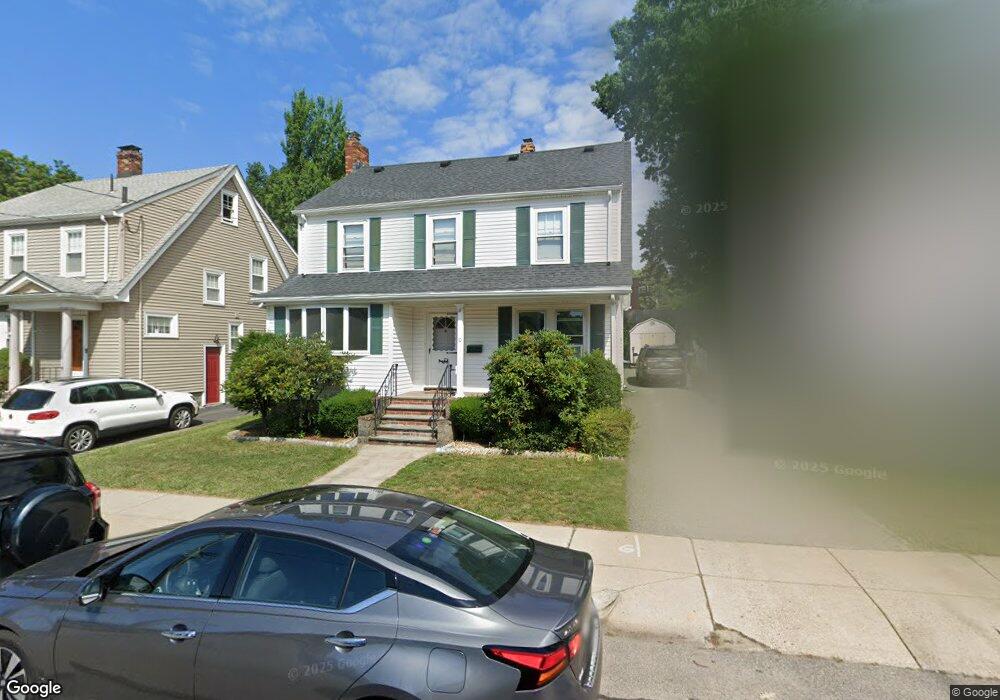
10 Quinn Way West Roxbury, MA 02132
Bellevue Hill NeighborhoodEstimated Value: $812,726 - $905,000
4
Beds
3
Baths
1,632
Sq Ft
$535/Sq Ft
Est. Value
About This Home
This home is located at 10 Quinn Way, West Roxbury, MA 02132 and is currently estimated at $873,182, approximately $535 per square foot. 10 Quinn Way is a home located in Suffolk County with nearby schools including St Theresa School, Holy Name Parish School, and The Roxbury Latin School.
Ownership History
Date
Name
Owned For
Owner Type
Purchase Details
Closed on
Jun 30, 2005
Sold by
Quirk Judith A and Sullivan Martin G
Bought by
Abbott Lawrence A and Abbott Mary E
Current Estimated Value
Home Financials for this Owner
Home Financials are based on the most recent Mortgage that was taken out on this home.
Original Mortgage
$330,000
Outstanding Balance
$173,042
Interest Rate
5.73%
Mortgage Type
Purchase Money Mortgage
Estimated Equity
$700,140
Create a Home Valuation Report for This Property
The Home Valuation Report is an in-depth analysis detailing your home's value as well as a comparison with similar homes in the area
Home Values in the Area
Average Home Value in this Area
Purchase History
| Date | Buyer | Sale Price | Title Company |
|---|---|---|---|
| Abbott Lawrence A | $440,000 | -- |
Source: Public Records
Mortgage History
| Date | Status | Borrower | Loan Amount |
|---|---|---|---|
| Open | Abbott Lawrence A | $330,000 |
Source: Public Records
Tax History Compared to Growth
Tax History
| Year | Tax Paid | Tax Assessment Tax Assessment Total Assessment is a certain percentage of the fair market value that is determined by local assessors to be the total taxable value of land and additions on the property. | Land | Improvement |
|---|---|---|---|---|
| 2025 | $8,386 | $724,200 | $265,400 | $458,800 |
| 2024 | $7,024 | $644,400 | $232,900 | $411,500 |
| 2023 | $6,529 | $607,900 | $219,700 | $388,200 |
| 2022 | $6,012 | $552,600 | $199,700 | $352,900 |
| 2021 | $5,549 | $520,100 | $193,900 | $326,200 |
| 2020 | $5,445 | $515,600 | $176,500 | $339,100 |
| 2019 | $5,079 | $481,900 | $146,700 | $335,200 |
| 2018 | $4,808 | $458,800 | $146,700 | $312,100 |
| 2017 | $4,809 | $454,100 | $146,700 | $307,400 |
| 2016 | $4,712 | $428,400 | $146,700 | $281,700 |
| 2015 | $4,972 | $410,600 | $153,100 | $257,500 |
| 2014 | $4,822 | $383,300 | $153,100 | $230,200 |
Source: Public Records
Map
Nearby Homes
- 425 Lagrange St Unit 203
- 348 Lagrange St
- 76 Potomac St
- 37 Hastings St Unit 103
- 73 Dent St Unit 1
- 27-29 Temple St
- 539 Lagrange St
- 183 Temple St
- 416 Belgrade Ave Unit 25
- 152 Stratford St
- 73 Woodard Rd
- 28 Dow Rd
- 275 Bellevue St
- 340 Baker St Unit 1
- 145 Lagrange St
- 89 Dwinell St
- 2231 Centre St
- 331 Vermont St
- 168 Maple St
- 63 Johnson St
- 6 Quinn Way
- 14 Quinn Way
- 18 Quinn Way
- 2 Quinn Way
- 1988 Centre St Unit 1990
- 22 Quinn Way Unit 24
- 28 Quinn Way
- 26 Quinn Way
- 26 Quinn Way Unit 1
- 26 Quinn Way Unit 26
- 1996 Centre St Unit Rear
- 1981 Centre St
- 1964 Centre St Unit 1966
- 1952 Centre St Unit 1954
- 2012 Centre St
- 44 Bellevue St
- 44 Bellevue St
- 44 Bellevue St Unit 44-2
- 44 Bellevue St Unit 1
- 44 Bellevue St Unit 2