Estimated Value: $1,528,000 - $1,881,000
4
Beds
3
Baths
2,986
Sq Ft
$574/Sq Ft
Est. Value
About This Home
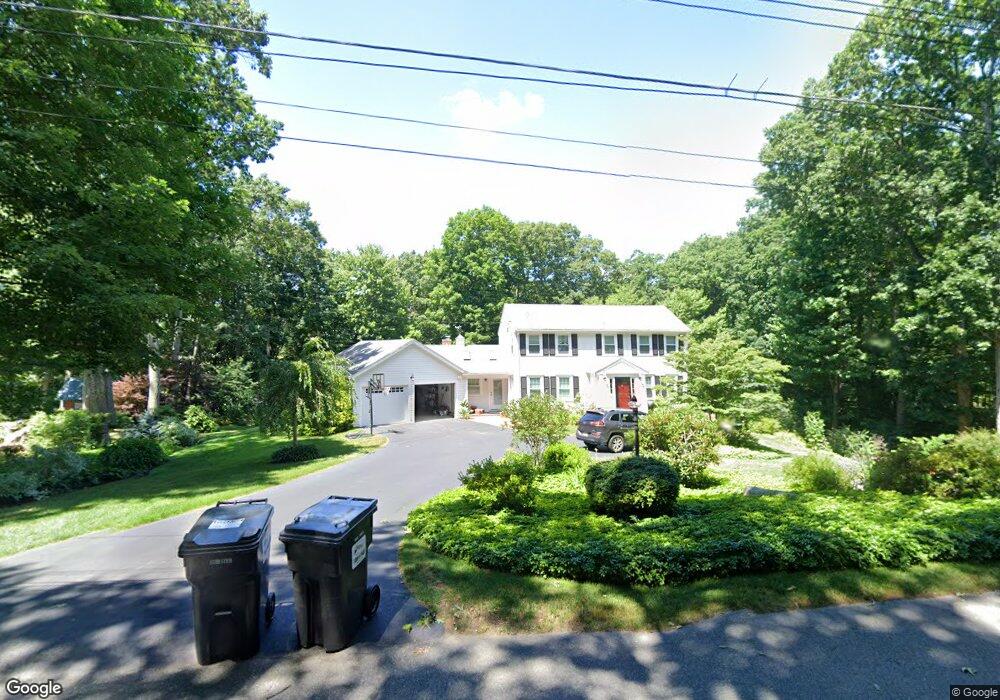
This home is located at 10 Raleigh Rd, Dover, MA 02030 and is currently estimated at $1,714,861, approximately $574 per square foot. 10 Raleigh Rd is a home located in Norfolk County with nearby schools including Chickering Elementary School, Dover-Sherborn Regional Middle School, and Dover-Sherborn Regional High School.
Ownership History
Date
Name
Owned For
Owner Type
Purchase Details
Closed on
Jan 25, 2022
Sold by
Moss Elizabeth W and Moss Stephen J
Bought by
Stephen J Moss Ret
Current Estimated Value
Purchase Details
Closed on
Feb 1, 2010
Sold by
Reczek Cosette M and Reczek Timothy J
Bought by
Moss Elizabeth W and Moss Stephen J
Purchase Details
Closed on
Mar 31, 2005
Sold by
Zeytoonjian Vivian
Bought by
Reczek Cosette M and Reczek Timothy J
Create a Home Valuation Report for This Property
The Home Valuation Report is an in-depth analysis detailing your home's value as well as a comparison with similar homes in the area
Home Values in the Area
Average Home Value in this Area
Purchase History
| Date | Buyer | Sale Price | Title Company |
|---|---|---|---|
| Stephen J Moss Ret | -- | None Available | |
| Moss Elizabeth W | $740,000 | -- | |
| Reczek Cosette M | $927,500 | -- |
Source: Public Records
Tax History
| Year | Tax Paid | Tax Assessment Tax Assessment Total Assessment is a certain percentage of the fair market value that is determined by local assessors to be the total taxable value of land and additions on the property. | Land | Improvement |
|---|---|---|---|---|
| 2025 | $15,603 | $1,384,500 | $664,400 | $720,100 |
| 2024 | $14,646 | $1,336,300 | $664,400 | $671,900 |
| 2023 | $14,309 | $1,173,800 | $588,200 | $585,600 |
| 2022 | $13,741 | $1,106,400 | $588,200 | $518,200 |
| 2021 | $13,729 | $1,065,100 | $566,400 | $498,700 |
| 2020 | $13,676 | $1,065,100 | $566,400 | $498,700 |
| 2019 | $13,772 | $1,065,100 | $566,400 | $498,700 |
| 2018 | $13,375 | $1,041,700 | $570,700 | $471,000 |
| 2017 | $12,516 | $959,100 | $479,300 | $479,800 |
| 2016 | $12,353 | $959,100 | $479,300 | $479,800 |
| 2015 | $11,876 | $935,100 | $455,300 | $479,800 |
Source: Public Records
Map
Nearby Homes
Your Personal Tour Guide
Ask me questions while you tour the home.