10 Redspire Ct Bolingbrook, IL 60490
East Bolingbrook NeighborhoodEstimated Value: $387,000 - $448,000
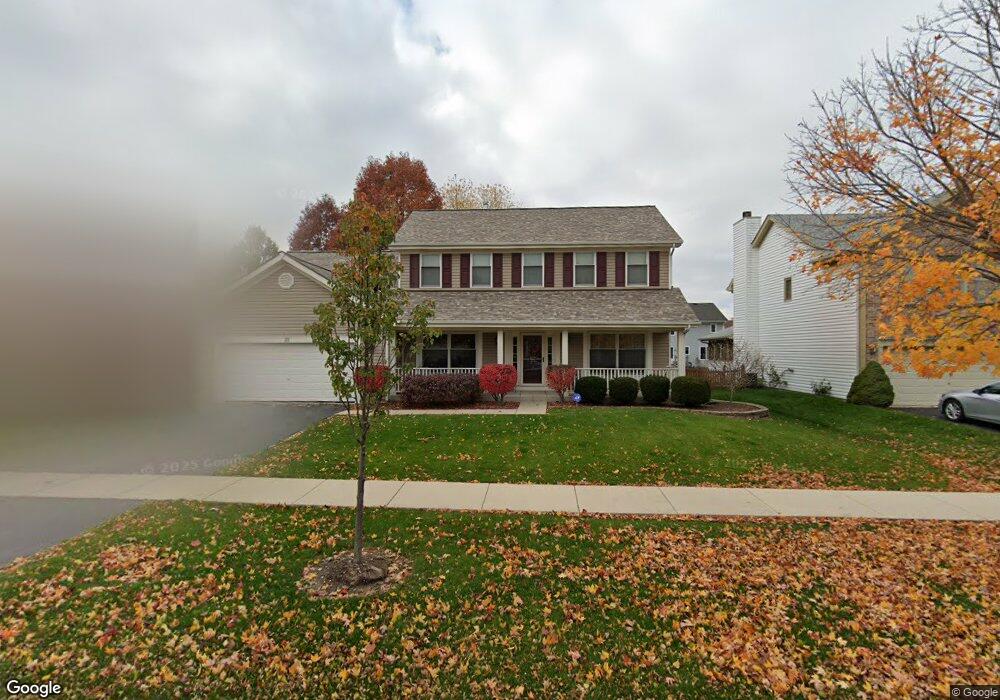
About This Home
This home is located at 10 Redspire Ct, Bolingbrook, IL 60490 and is currently estimated at $423,247, approximately $200 per square foot. 10 Redspire Ct is a home located in Will County with nearby schools including Pioneer Elementary School, Brooks Middle School, and Bolingbrook High School.
Ownership History
We collect this data history from publicly available records. To have your information removed, we recommend requesting removal directly through your county’s website.
Purchase Details
Purchase Details
Home Financials for this Owner
Home Financials are based on the most recent Mortgage that was taken out on this home.Home Values in the Area
Average Home Value in this Area
Purchase History
We collect this data history from publicly available records. To have your information removed, we recommend requesting removal directly through your county’s website.
| Date | Buyer | Sale Price | Title Company |
|---|---|---|---|
| -- | -- | ||
| $183,000 | Chicago Title Insurance Co |
Mortgage History
We collect this data history from publicly available records. To have your information removed, we recommend requesting removal directly through your county’s website.
| Date | Status | Borrower | Loan Amount |
|---|---|---|---|
| Previous Owner | $135,000 |
Tax History
We collect this data history from publicly available records. To have your information removed, we recommend requesting removal directly through your county’s website.
| Year | Tax Paid | Tax Assessment Tax Assessment Total Assessment is a certain percentage of the fair market value that is determined by local assessors to be the total taxable value of land and additions on the property. | Land | Improvement |
|---|---|---|---|---|
| 2024 | $12,446 | $135,751 | $20,719 | $115,032 |
| 2023 | $11,798 | $122,144 | $18,642 | $103,502 |
| 2022 | $10,292 | $110,119 | $16,807 | $93,312 |
| 2021 | $9,762 | $102,963 | $15,715 | $87,248 |
| 2020 | $9,536 | $99,577 | $15,198 | $84,379 |
| 2019 | $9,165 | $94,835 | $14,474 | $80,361 |
| 2018 | $8,804 | $90,768 | $13,853 | $76,915 |
| 2017 | $8,389 | $86,036 | $13,131 | $72,905 |
| 2016 | $8,151 | $81,900 | $12,500 | $69,400 |
| 2015 | $7,891 | $77,100 | $11,800 | $65,300 |
| 2014 | $7,891 | $77,100 | $11,800 | $65,300 |
| 2013 | $7,891 | $77,100 | $11,800 | $65,300 |
Map
- 307 Inner Circle Dr
- 337 Inner Circle Dr
- 309 Thistle Dr
- 513 Pheasant Chase Dr
- 2 Buckboard Ct
- 19 Lily Ct
- 1070 Lily Field Ln
- 395 S Palmer Dr Unit 2B
- 2 Marshall Ash Ct
- 615 Red Barn Trail
- 385 Marshall Ash St Unit 3
- 109 S Canyon Dr
- 269 S Palmer Dr
- 371 Sweet Gum St Unit 3
- 1528 Schumacher Dr
- 720 Countryside Dr
- 1571 Woodland Ln
- 1078 Towner Dr
- 6 Sunshine Ct
- 1446 Glenside Dr Unit 3A
Ask me questions while you tour the home.