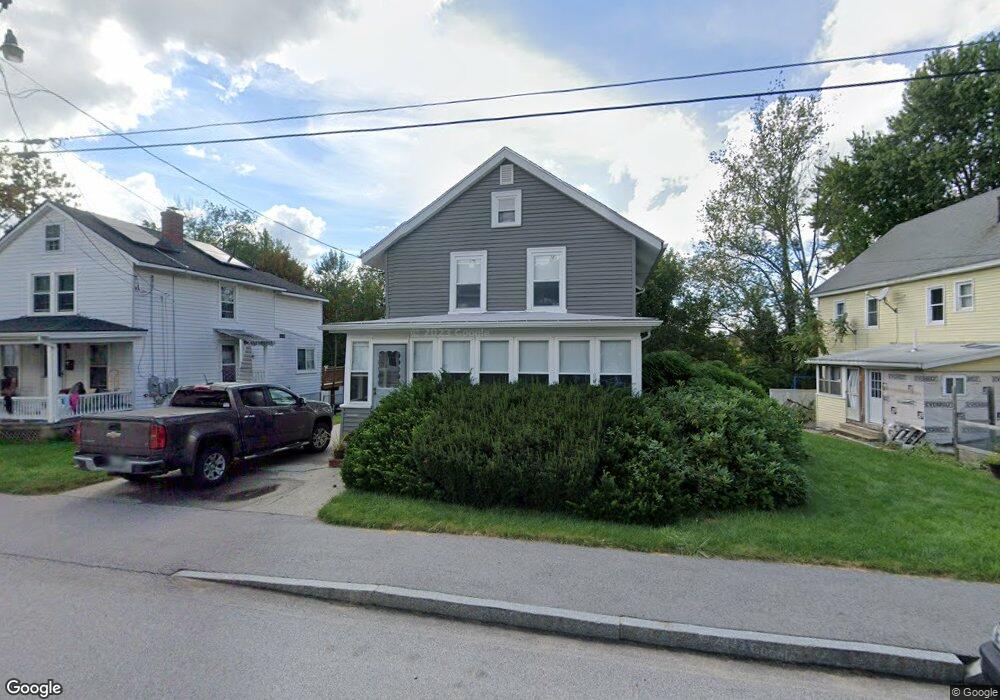
10 Reynolds St Allenstown, NH 03275
Suncook NeighborhoodEstimated Value: $363,000 - $412,005
3
Beds
2
Baths
1,848
Sq Ft
$213/Sq Ft
Est. Value
About This Home
This home is located at 10 Reynolds St, Allenstown, NH 03275 and is currently estimated at $393,001, approximately $212 per square foot. 10 Reynolds St is a home located in Merrimack County with nearby schools including Allenstown Elementary School, Armand R. Dupont School, and Tender Years Child Care & Learning Center.
Ownership History
Date
Name
Owned For
Owner Type
Purchase Details
Closed on
Jan 22, 2024
Sold by
York Marie and Spivack Amy
Bought by
Brashears Jerome R
Current Estimated Value
Home Financials for this Owner
Home Financials are based on the most recent Mortgage that was taken out on this home.
Original Mortgage
$350,000
Outstanding Balance
$343,967
Interest Rate
7.03%
Mortgage Type
Purchase Money Mortgage
Estimated Equity
$49,034
Create a Home Valuation Report for This Property
The Home Valuation Report is an in-depth analysis detailing your home's value as well as a comparison with similar homes in the area
Home Values in the Area
Average Home Value in this Area
Purchase History
| Date | Buyer | Sale Price | Title Company |
|---|---|---|---|
| Brashears Jerome R | $350,000 | None Available |
Source: Public Records
Mortgage History
| Date | Status | Borrower | Loan Amount |
|---|---|---|---|
| Open | Brashears Jerome R | $350,000 |
Source: Public Records
Tax History Compared to Growth
Tax History
| Year | Tax Paid | Tax Assessment Tax Assessment Total Assessment is a certain percentage of the fair market value that is determined by local assessors to be the total taxable value of land and additions on the property. | Land | Improvement |
|---|---|---|---|---|
| 2024 | $8,068 | $317,400 | $134,400 | $183,000 |
| 2023 | $6,729 | $317,400 | $134,400 | $183,000 |
| 2022 | $6,189 | $317,400 | $134,400 | $183,000 |
| 2021 | $6,146 | $195,100 | $77,800 | $117,300 |
| 2020 | $5,716 | $195,100 | $77,800 | $117,300 |
| 2019 | $6,068 | $195,100 | $77,800 | $117,300 |
| 2018 | $5,882 | $195,100 | $77,800 | $117,300 |
| 2017 | $6,265 | $195,100 | $77,800 | $117,300 |
| 2016 | $5,018 | $148,200 | $44,900 | $103,300 |
| 2015 | $4,865 | $148,200 | $44,900 | $103,300 |
| 2014 | $5,006 | $148,200 | $44,900 | $103,300 |
| 2013 | $4,720 | $149,700 | $44,900 | $104,800 |
Source: Public Records
Map
Nearby Homes
- 7 Ferry St
- 4 Rodger Rd
- 100 Main St Unit M10
- 100 Main St Unit 204
- 15 Main St
- 12-14 Church St Unit 12,14
- 111 Glass St
- 422 Dawn Dr Unit 23
- 427 Dawn Dr Unit 15
- 1 1/2 Bartlett St
- 19 Sullivan Dr
- 233 Pembroke St
- 259 Pembroke St
- 10 Lane Dr
- 307 Dearborn Rd
- 2 Cheryl Dr
- 10 Winchester Ct
- 15 Sullivan Dr
- 1821 Hooksett Rd
- 62 Pine St