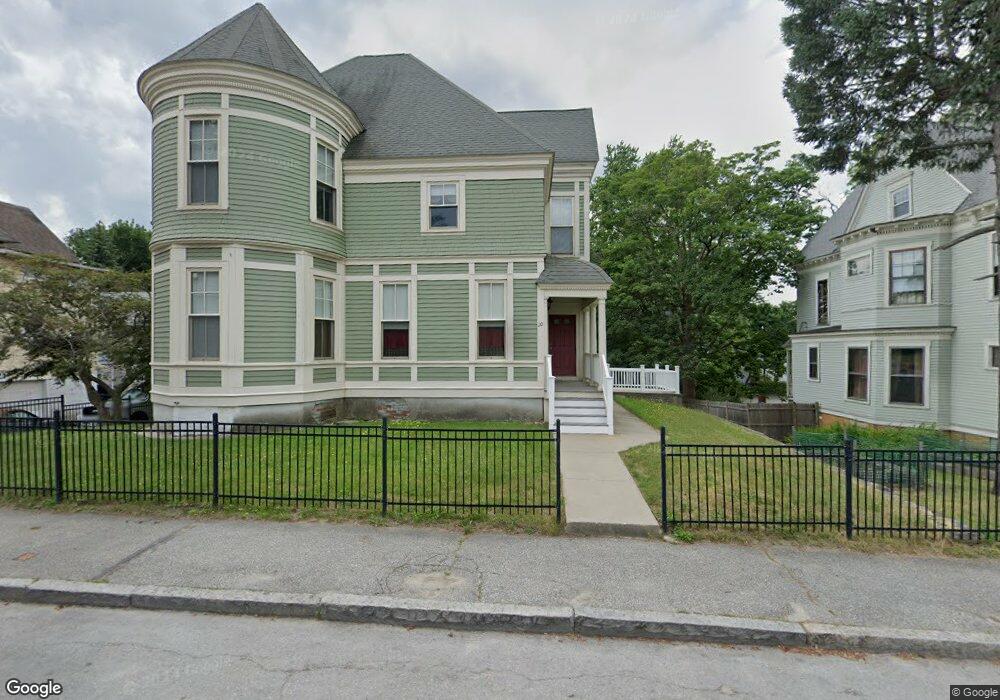
10 Ripley St Worcester, MA 01610
Beacon Brightly NeighborhoodEstimated Value: $131,795 - $631,000
4
Beds
2
Baths
2,590
Sq Ft
$177/Sq Ft
Est. Value
About This Home
This home is located at 10 Ripley St, Worcester, MA 01610 and is currently estimated at $457,199, approximately $176 per square foot. 10 Ripley St is a home located in Worcester County with nearby schools including Jacob Hiatt Magnet School, Chandler Magnet, and Woodland Academy.
Ownership History
Date
Name
Owned For
Owner Type
Purchase Details
Closed on
Dec 28, 2016
Sold by
Main South Community D
Bought by
Nuestras Casas Lp
Current Estimated Value
Home Financials for this Owner
Home Financials are based on the most recent Mortgage that was taken out on this home.
Original Mortgage
$4,000,000
Outstanding Balance
$3,262,884
Interest Rate
3.94%
Mortgage Type
Purchase Money Mortgage
Estimated Equity
-$2,805,685
Purchase Details
Closed on
Oct 17, 2005
Sold by
Worcester City Of
Bought by
Main South Cmnty Dev C
Purchase Details
Closed on
Dec 31, 1993
Sold by
Ripley Real Est R T
Bought by
Ripley Real Est R T and Karstetter Allan
Purchase Details
Closed on
Oct 3, 1990
Sold by
10 Ripley St Rt
Bought by
Ripley Real Est Rt
Purchase Details
Closed on
Sep 29, 1989
Sold by
Greene Stephen
Bought by
City Of Worcester
Purchase Details
Closed on
Apr 4, 1988
Sold by
Collins James P
Bought by
10 Ripley St Rlty Tr
Create a Home Valuation Report for This Property
The Home Valuation Report is an in-depth analysis detailing your home's value as well as a comparison with similar homes in the area
Home Values in the Area
Average Home Value in this Area
Purchase History
| Date | Buyer | Sale Price | Title Company |
|---|---|---|---|
| Nuestras Casas Lp | $3,717,417 | -- | |
| Nuestras Casas Lp | $3,717,417 | -- | |
| Main South Cmnty Dev C | $72,500 | -- | |
| Main South Cmnty Dev C | $72,500 | -- | |
| Ripley Real Est R T | $30,000 | -- | |
| Ripley Real Est R T | $30,000 | -- | |
| Ripley Real Est Rt | $125,000 | -- | |
| Ripley Real Est Rt | $125,000 | -- | |
| City Of Worcester | $1,740 | -- | |
| City Of Worcester | $1,740 | -- | |
| 10 Ripley St Rlty Tr | $159,585 | -- |
Source: Public Records
Mortgage History
| Date | Status | Borrower | Loan Amount |
|---|---|---|---|
| Open | Nuestras Casas Lp | $4,000,000 | |
| Closed | Nuestras Casas Lp | $4,000,000 | |
| Previous Owner | 10 Ripley St Rlty Tr | $3,000,000 |
Source: Public Records
Tax History Compared to Growth
Tax History
| Year | Tax Paid | Tax Assessment Tax Assessment Total Assessment is a certain percentage of the fair market value that is determined by local assessors to be the total taxable value of land and additions on the property. | Land | Improvement |
|---|---|---|---|---|
| 2025 | $1,636 | $124,033 | $76,700 | $47,333 |
| 2024 | $1,561 | $113,508 | $76,700 | $36,808 |
| 2023 | $1,628 | $113,508 | $61,500 | $52,008 |
| 2022 | $1,676 | $110,202 | $49,200 | $61,002 |
| 2021 | $1,794 | $110,202 | $39,400 | $70,802 |
| 2020 | $3,993 | $234,900 | $39,500 | $195,400 |
| 2019 | $4,208 | $233,800 | $39,000 | $194,800 |
| 2018 | $4,092 | $216,400 | $39,000 | $177,400 |
| 2017 | $3,848 | $200,200 | $39,000 | $161,200 |
| 2016 | $3,889 | $188,700 | $31,100 | $157,600 |
| 2015 | $3,787 | $188,700 | $31,100 | $157,600 |
| 2014 | $3,687 | $188,700 | $31,100 | $157,600 |
Source: Public Records
Map
Nearby Homes
- 8 Ripley St
- 2-4 Thayer Ct Unit 3
- 2-4 Thayer Ct Unit 2
- 2 Thayer Ct Unit 4
- 4 Thayer Ct Unit 3
- 2 Thayer Ct
- 4 Thayer Ct Unit 1
- 4 Thayer Ct
- 24 Thayer Ct Unit 2
- 24 Thayer Ct Unit 3
- 1 Thayer Ct
- 20 Ripley C-12 St
- 9 Boys And Girls Club Way
- 875 1/2 Main St
- 5 Kilby St
- 4 Grout Ct
- 11A Kilby St
- 9 Kilby St
- 6 Grout Ct
- 11B Kilby St