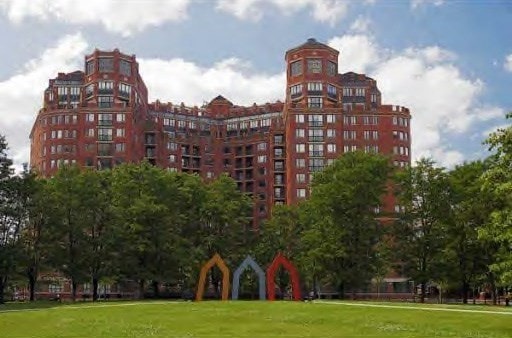
River Court 10 Rogers St Unit 302 Cambridge, MA 02142
East Cambridge NeighborhoodHighlights
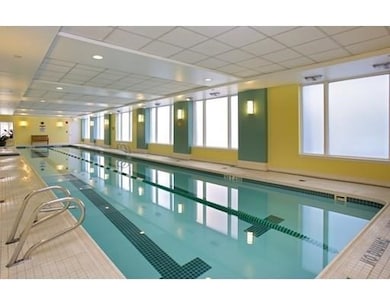
- Indoor Pool
- Property is near public transit
- Intercom
- Deck
- Jogging Path
- 1-minute walk to Charles River Reservation
About This Home
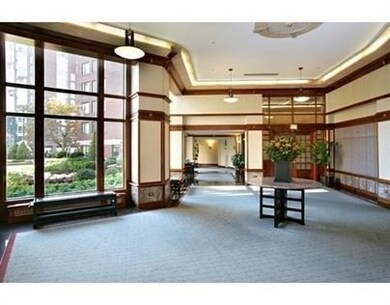
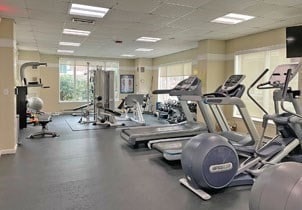
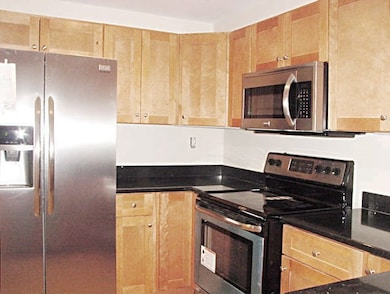
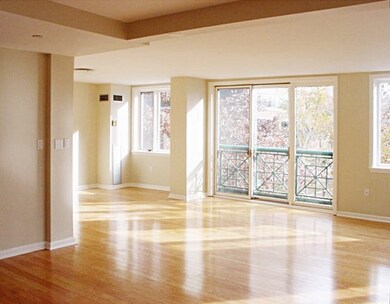
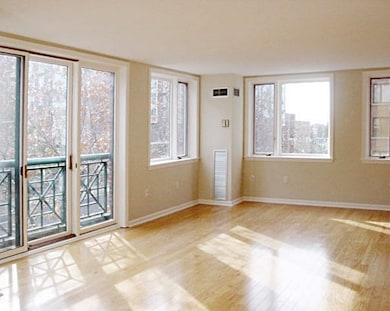
PARKING AND STORAGE INCLUDED IN THE RENT. Extra large two bedroom unit with study area. Bright and spacious living/dining room facing Charles River. Luxurious marble bath. Hardwood floors. In-unit laundry. kitchen with granite counter tops and stainless appliances. Garage parking. 24-hour concierge service. Health club and indoor pool. Steps to restaurants, transportation, MIT, MGH, Biogen, Genzyme and Harvard.The building has two guest suites for your visitors.
Condo Details
Home Type
- Condominium
Est. Annual Taxes
- $9,174
Year Built
- Built in 1989
Parking
- 1 Car Garage
Home Design
- 1,631 Sq Ft Home
Kitchen
- Oven
- Range
- Microwave
- Freezer
- Dishwasher
- Disposal
Bedrooms and Bathrooms
- 2 Bedrooms
- 3 Full Bathrooms
Laundry
- Laundry in unit
- Washer and Dryer
Home Security
- Home Security System
- Intercom
Outdoor Features
- Indoor Pool
- Deck
Location
- Property is near public transit
- Property is near schools
Utilities
- Cooling Available
- Heat Pump System
Listing and Financial Details
- Security Deposit $5,500
- Property Available on 8/1/25
- Rent includes water, sewer, trash collection, snow removal, recreational facilities, gardener, swimming pool, extra storage, parking, security
- 12 Month Lease Term
- Assessor Parcel Number 5204955
Community Details
Recreation
- Park
- Jogging Path
- Bike Trail
Pet Policy
- No Pets Allowed
Additional Features
- Property has a Home Owners Association
- Shops
Map
About River Court
Source: MLS Property Information Network (MLS PIN)
MLS Number: 73382517
APN: CAMB-000011-000000-000043-000302
Disclaimer: Certain information contained herein is derived from information provided by parties other than Homes.com. All information provided is deemed reliable, but is not guaranteed to be accurate and should be independently verified.
![]() The property listing data and information, or the Images, set forth herein were provided to MLS Property Information Network, Inc. from third party sources, including sellers, lessors and public records, and were compiled by MLS Property Information Network, Inc. The property listing data and information, and the Images, are for the personal, non-commercial use of consumers having a good faith interest in purchasing or leasing listed properties of the type displayed to them and may not be used for any purpose other than to identify prospective properties which such consumers may have a good faith interest in purchasing or leasing. MLS Property Information Network, Inc. and its subscribers disclaim any and all representations and warranties as to the accuracy of the property listing data and information, or as to the accuracy of any of the Images, set forth herein.
The property listing data and information, or the Images, set forth herein were provided to MLS Property Information Network, Inc. from third party sources, including sellers, lessors and public records, and were compiled by MLS Property Information Network, Inc. The property listing data and information, and the Images, are for the personal, non-commercial use of consumers having a good faith interest in purchasing or leasing listed properties of the type displayed to them and may not be used for any purpose other than to identify prospective properties which such consumers may have a good faith interest in purchasing or leasing. MLS Property Information Network, Inc. and its subscribers disclaim any and all representations and warranties as to the accuracy of the property listing data and information, or as to the accuracy of any of the Images, set forth herein.
- 10 Rogers St Unit 213
- 10 Rogers St Unit 703
- 10 Rogers St Unit 1119
- 10 Rogers St Unit 707
- 10 Rogers St Unit PH19
- 75-83 Cambridge Pkwy Unit W403
- 75-83 Cambridge Pkwy Unit E 802
- 75-83 Cambridge Pkwy Unit W702
- 75-83 Cambridge Pkwy Unit E902
- 75-83 Cambridge Pkwy Unit 303
- 75-83 Cambridge Pkwy Unit W1009
- 212 Third St
- 133 Charles St Unit 133
- 131 Charles St
- 152 Charles St Unit 2
- 6 Canal Park Unit 703
- 4 Canal Park Unit 311
- 20 Second St Unit 222
- 150 Cambridge St Unit A403
- 253 Cambridge St
- 10 Rogers St Unit 209
- 10 Rogers St Unit 203
- 10 Rogers St Unit 804
- 10 Rogers St Unit PH2
- 50 Rogers St Unit 611
- 50 Rogers St Unit 415
- 50 Rogers St Unit 616
- 50 Rogers St Unit 103
- 50 Rogers St Unit 501
- 50 Rogers St Unit 522
- 50 Rogers St Unit 617
- 50 Rogers St Unit 224
- 50 Rogers St Unit 424
- 50 Rogers St Unit 626
- 50 Rogers St Unit 615
- 50 Rogers St Unit 417
- 50 Rogers St Unit 222
- 50 Rogers St Unit 512
- 50 Rogers St Unit 204
- 33 Rogers St Unit FL2-ID1156
